Reason to trust
How Our News is Made
Strict editorial policy that focuses on accuracy, relevance, and impartiality
Ad discliamer
Morbi pretium leo et nisl aliquam mollis. Quisque arcu lorem, ultricies quis pellentesque nec, ullamcorper eu odio.
- Ripple price rallied recently above the $0.3200 and $0.3300 resistances against the US dollar.
- The price is up more than 15% and it recently climbed above the $0.3500 resistance area.
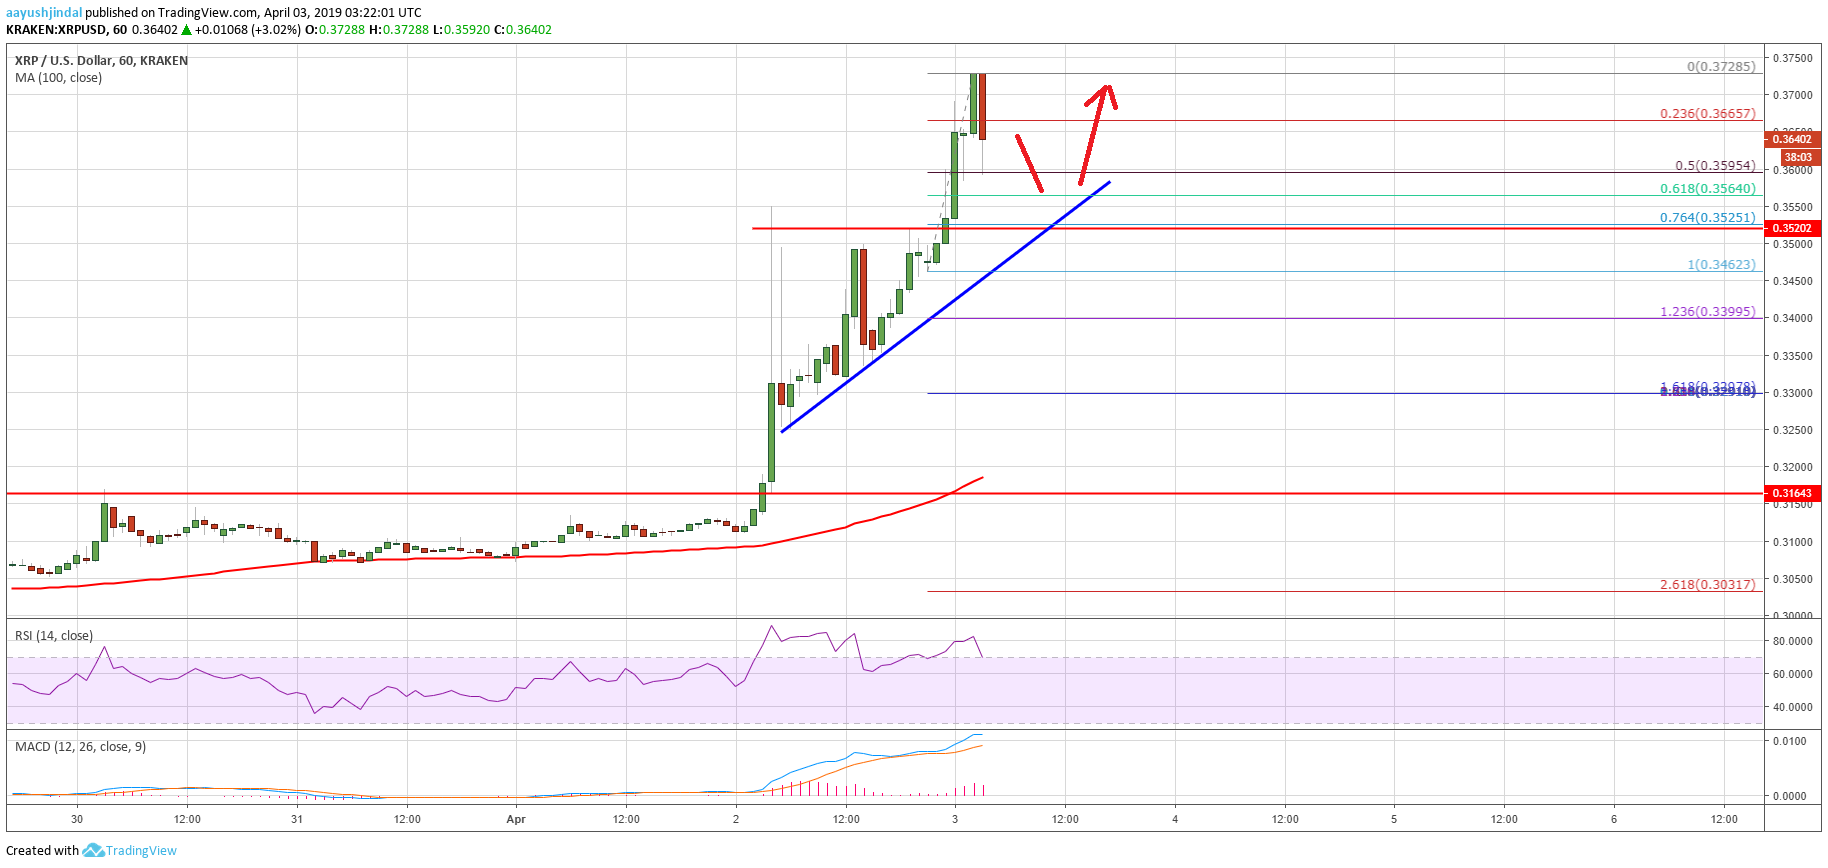
- There is a major bullish trend line in place with support at $0.3560 on the hourly chart of the XRP/USD pair (data source from Kraken).
- The pair is placed in a strong uptrend and it is likely to grind above the $0.3800 and $0.4000 resistance levels.
Ripple price started a strong uptrend above $0.3400 against the US Dollar after bitcoin price rise. XRP is likely to accelerate higher and it might even clear the $0.4000 resistance level.
Ripple Price Analysis
Yesterday, there was a start of a strong uptrend in the crypto market, opening doors for a break above $0.3200 in ripple price against the US Dollar. The XRP/USD pair broke a few important resistances near $0.3200 and $0.3240 to move into an uptrend. Later, the price rallied sharply above the $0.3300 and $0.3500 resistance levels. The price even climbed above the $0.3600 barrier and settled well above the 100 hourly simple moving average.
A new yearly high was formed near $0.3722 and the price is currently correcting gains. It recently traded below the $0.3650 support and the 23.6% Fib retracement level of the last wave from the $0.3462 low to $0.3722 high. However, there are many supports near the $0.3600 and $0.3550 levels. Besides, the 50% Fib retracement level of the last wave from the $0.3462 low to $0.3722 high prevented the recent drop. There is also a major bullish trend line in place with support at $0.3560 on the hourly chart of the XRP/USD pair.
The trend line coincides with the 61.8% Fib retracement level of the last wave from the $0.3462 low to $0.3722 high. Therefore, if the price corrects lower towards the $0.3600 and $0.3560 levels, it could find a strong buying interest. Below the trend line support, the price might test the $0.3500 level. On the upside, a clear break above the $0.3750 resistance is likely to push the price towards the $0.3880 level.
Looking at the chart, ripple price is trading heavily into a positive zone above $0.3500 and $0.3600. If buyers remain in charge, there are chances of a strong rise towards the $0.4000 level. On the downside, buying in the short term towards $0.3600 or $0.3500 might be considered with a tight stop.
Technical Indicators
Hourly MACD – The MACD for XRP/USD is placed heavily in the bullish zone.
Hourly RSI (Relative Strength Index) – The RSI for XRP/USD is currently correcting lower from the overbought zone.
Major Support Levels – $0.3600, $0.3560 and $0.3550.
Major Resistance Levels – $0.3750, $0.3880 and $0.4000.