
Reason to trust
How Our News is Made
Strict editorial policy that focuses on accuracy, relevance, and impartiality
Ad discliamer
Morbi pretium leo et nisl aliquam mollis. Quisque arcu lorem, ultricies quis pellentesque nec, ullamcorper eu odio.
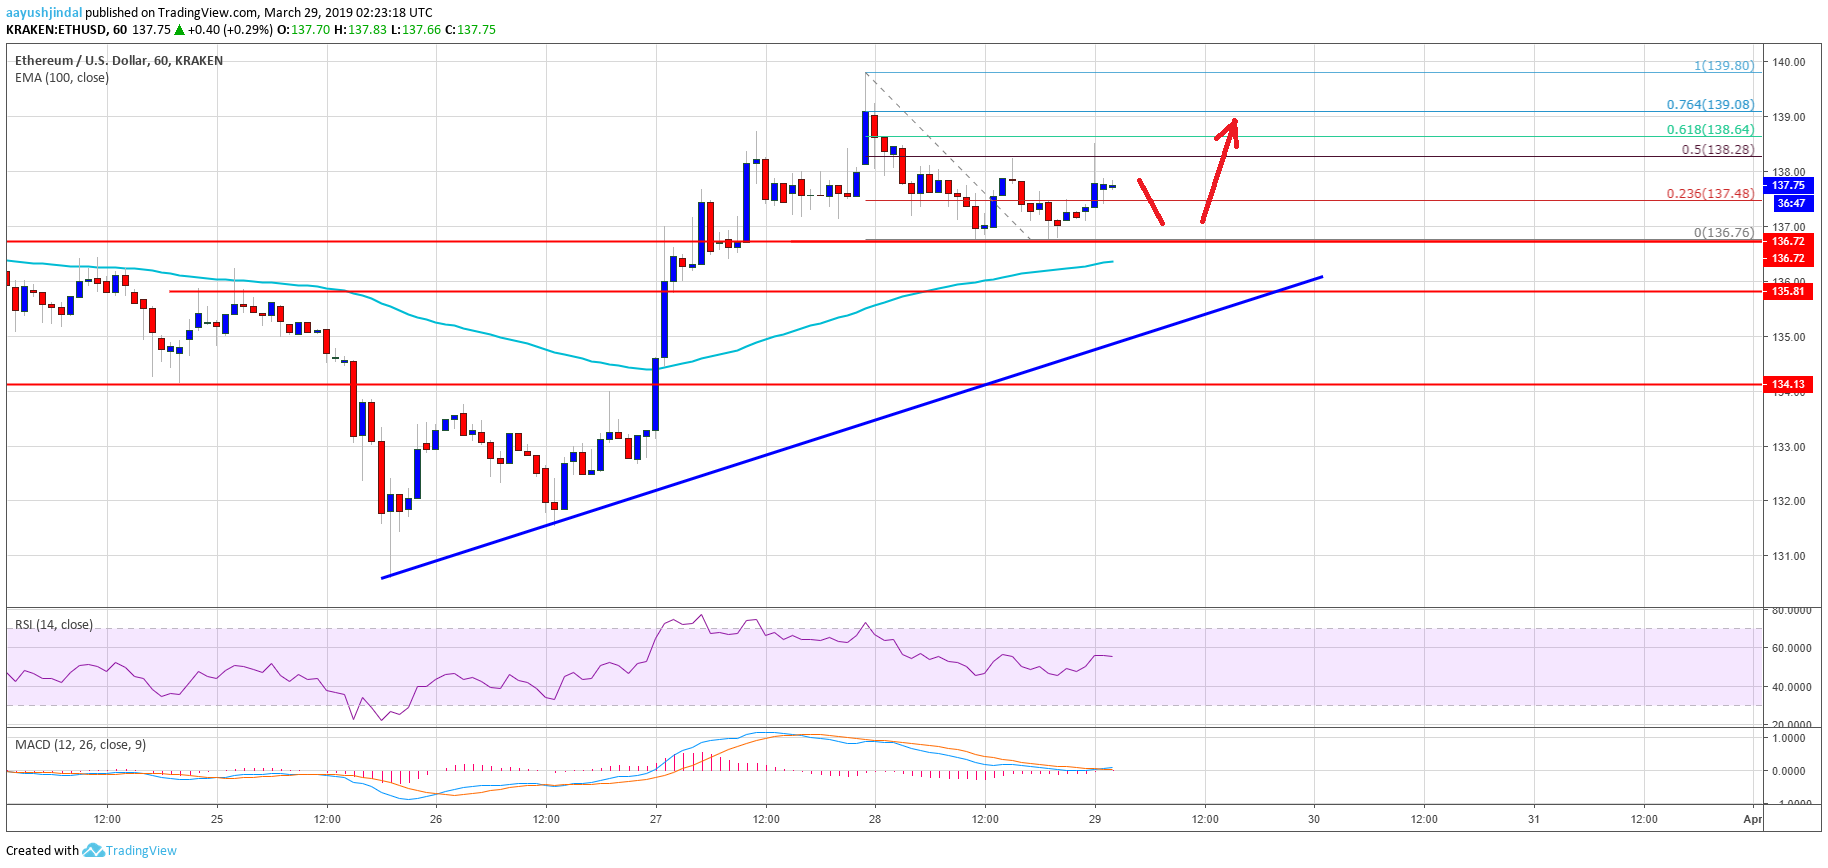
- ETH price corrected lower recently after trading close to the $140 resistance against the US Dollar.
- The price tested the key $137 support level, which was a resistance earlier.
- There is a new connecting bullish trend line formed with support above $135 on the hourly chart of ETH/USD (data feed via Kraken).
- Bulls are currently battling near the $137 support as the price remains in a bullish zone.
Ethereum price is consolidating above key supports against the US Dollar and bitcoin. ETH could pump higher once it clears the $139 and $140 resistance levels in the near term.
Ethereum Price Analysis
Earlier this week, we saw a sharp upward move in ETH price above the $135 resistance against the US Dollar. The ETH/USD pair even traded above the $137 resistance and the 100 hourly simple moving average. Buyers pushed the price towards the $140 resistance, where it faced a strong selling interest. As a result, the price corrected lower below the $138 support level. However, the previous resistance level near $137 prevented declines and acted as a strong support.
The price recovered recently above the 23.6% Fib retracement level of the recent decline from the $140 swing high to $137 swing low. However, the current price action suggests range moves as the recent recovery was capped by the $139 level. Besides, the 50% Fib retracement level of the recent decline from the $140 swing high to $137 swing low acted as a resistance. It seems like bulls are putting up a strong fight to protect the $137 support area. If there are more losses, the price may test the $136 support and the 100 hourly simple moving average.
More importantly, there is a new connecting bullish trend line formed with support above $135 on the hourly chart of ETH/USD. Therefore, there are many supports on the downside near the $137, $136 and $135 levels. On the upside, the price must gain momentum above the $139 and $140 resistance. If buyers gain bullish momentum, the price is likely to accelerate above the $144 level in the near term.
Looking at the chart, Ethereum price is trading nicely above the $136-137 support area. In the short term, there could be range moves above the $136 level before the price moves higher again. On the upside, a break above the $140 barrier is likely to give buyers more control. In the mentioned case, the price might rally sharply above the $142 and $144 levels.
ETH Technical Indicators
Hourly MACD – The MACD for ETH/USD is about to jump back in the bullish zone.
Hourly RSI – The RSI for ETH/USD is currently placed nicely above the 50 level.
Major Support Level – $136
Major Resistance Level – $140


