
Reason to trust
How Our News is Made
Strict editorial policy that focuses on accuracy, relevance, and impartiality
Ad discliamer
Morbi pretium leo et nisl aliquam mollis. Quisque arcu lorem, ultricies quis pellentesque nec, ullamcorper eu odio.
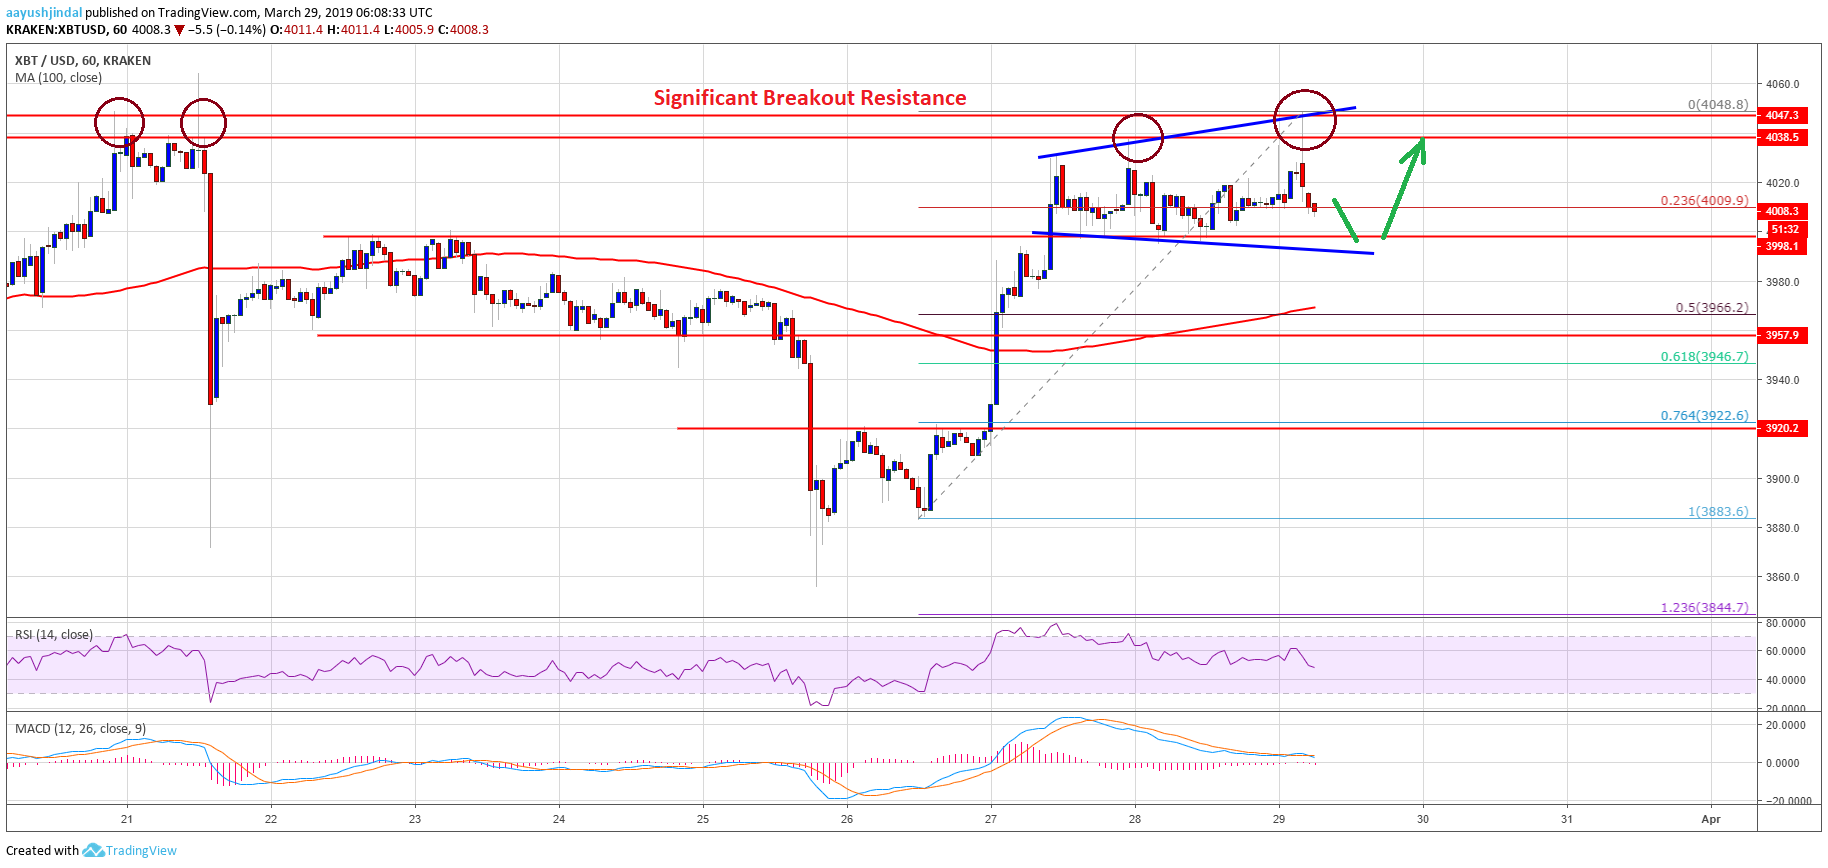
- Bitcoin price spiked higher and tested the main resistance at $4,050 against the US Dollar.
- The price is currently correcting lower, but dips remain supported near $4,000.
- There is an expanding triangle formed with resistance near $4,050 on the hourly chart of the BTC/USD pair (data feed from Kraken).
- The pair might dip towards the $4,000 or $3,980 support before a fresh upward move.
Bitcoin price is currently flirting with a major resistance zone against the US Dollar. BTC could rally significantly once there is a break above the $4,050 monthly resistance.
Bitcoin Price Analysis
Recently, we saw a decent upward move above the $3,940 resistance in bitcoin price against the US Dollar. The BTC/USD pair climbed above the $4,000 resistance and the 100 hourly simple moving average. Later, there were range moves above the $4,000 support level. Finally, there was an upside extension above the $4,020 resistance level. However, buyers faced a strong resistance near the $4,040 and $4,050 levels (previous swing highs). A fresh weekly high was formed at $4,048 and later the price corrected lower.
It moved below the $4,020 level and the 23.6% Fib retracement level of the recent upside from the $3,883 low to $4,048 high. On the downside, there is a strong support formed near the $4,000 level. There is also an expanding triangle formed with resistance near $4,050 on the hourly chart of the BTC/USD pair. The triangle support is near the $3,990 level, below which the price may test the $3,980 support.
The next main support is at $3,965 and the 50% Fib retracement level of the recent upside from the $3,883 low to $4,048 high. Therefore, dips towards the $4,000 and $3,980 levels are likely to find buyers. On the upside, the $4,040 and $4,050 levels are strong barriers. A successful hourly close above $4,050 is must for buyers to gain momentum. The next resistance is at $4,080, above which the price may test the $4,120 level.
Looking at the chart, bitcoin price seems to be consolidating above the $4,000 support. However, the $4,050 range resistance is acting as a strong offer zone. If the price continues to fail near $4,050, there is a risk of a downside reaction. In the mentioned case, the price might even clear the $4,000 and $3,980 supports. The next level where buyers are likely to take a stand is near $3,965 and the 100 hourly SMA.
Technical indicators:
Hourly MACD – The MACD is slowly moving back in the bearish zone.
Hourly RSI (Relative Strength Index) – The RSI for BTC/USD is currently moving lower and it could break the 50 level.
Major Support Levels – $4,000 followed by $3,965.
Major Resistance Levels – $4,040, $4,050 and $4,080.