Reason to trust
How Our News is Made
Strict editorial policy that focuses on accuracy, relevance, and impartiality
Ad discliamer
Morbi pretium leo et nisl aliquam mollis. Quisque arcu lorem, ultricies quis pellentesque nec, ullamcorper eu odio.
- ETH price started a solid upward move and traded above the $138 resistance against the US Dollar.
- The price tested the $140 resistance and it seems like there could be more gains.
- There is an ascending channel in place with support at $138 on the hourly chart of ETH/USD (data feed via Kraken).
- The pair is likely to accelerate higher once there is a clear break above the $140 resistance level.
Ethereum price is following a convincing bullish path against the US Dollar and bitcoin. ETH is likely to pump above the $140 resistance area in the coming sessions.
Ethereum Price Analysis
After a major drop, ETH price found support near the $130 area against the US Dollar. The ETH/USD pair started a solid recovery and broke the $134 and $135 resistance levels. Later, there was a close above the $135 barrier and the 100 hourly simple moving average. There were slow and steady gains above the $137 and $138 levels. The price even traded above the $139 level recently and tested the $140 resistance level. A swing high was formed near $140 and the price is currently consolidating gains.
An initial support is near the $138 level. It coincides with the 23.6% Fib retracement level of the recent wave from the $133 swing low to $140 high. There is also an ascending channel in place with support at $138 on the hourly chart of ETH/USD. Therefore, the price is likely to follow a solid bullish path as long as it is above the $138 support. If there is a downside break below the channel support, the price may test the $136 support area.
The 50% Fib retracement level of the recent wave from the $133 swing low to $140 high is also near the $136 level. Finally, the next support is near the $135 level and the 100 hourly simple moving average. On the upside, an initial resistance is near the $140 level, representing a crucial barrier for buyers. If there is an upside break above the $140 resistance, there could be heavy gains in the coming sessions.
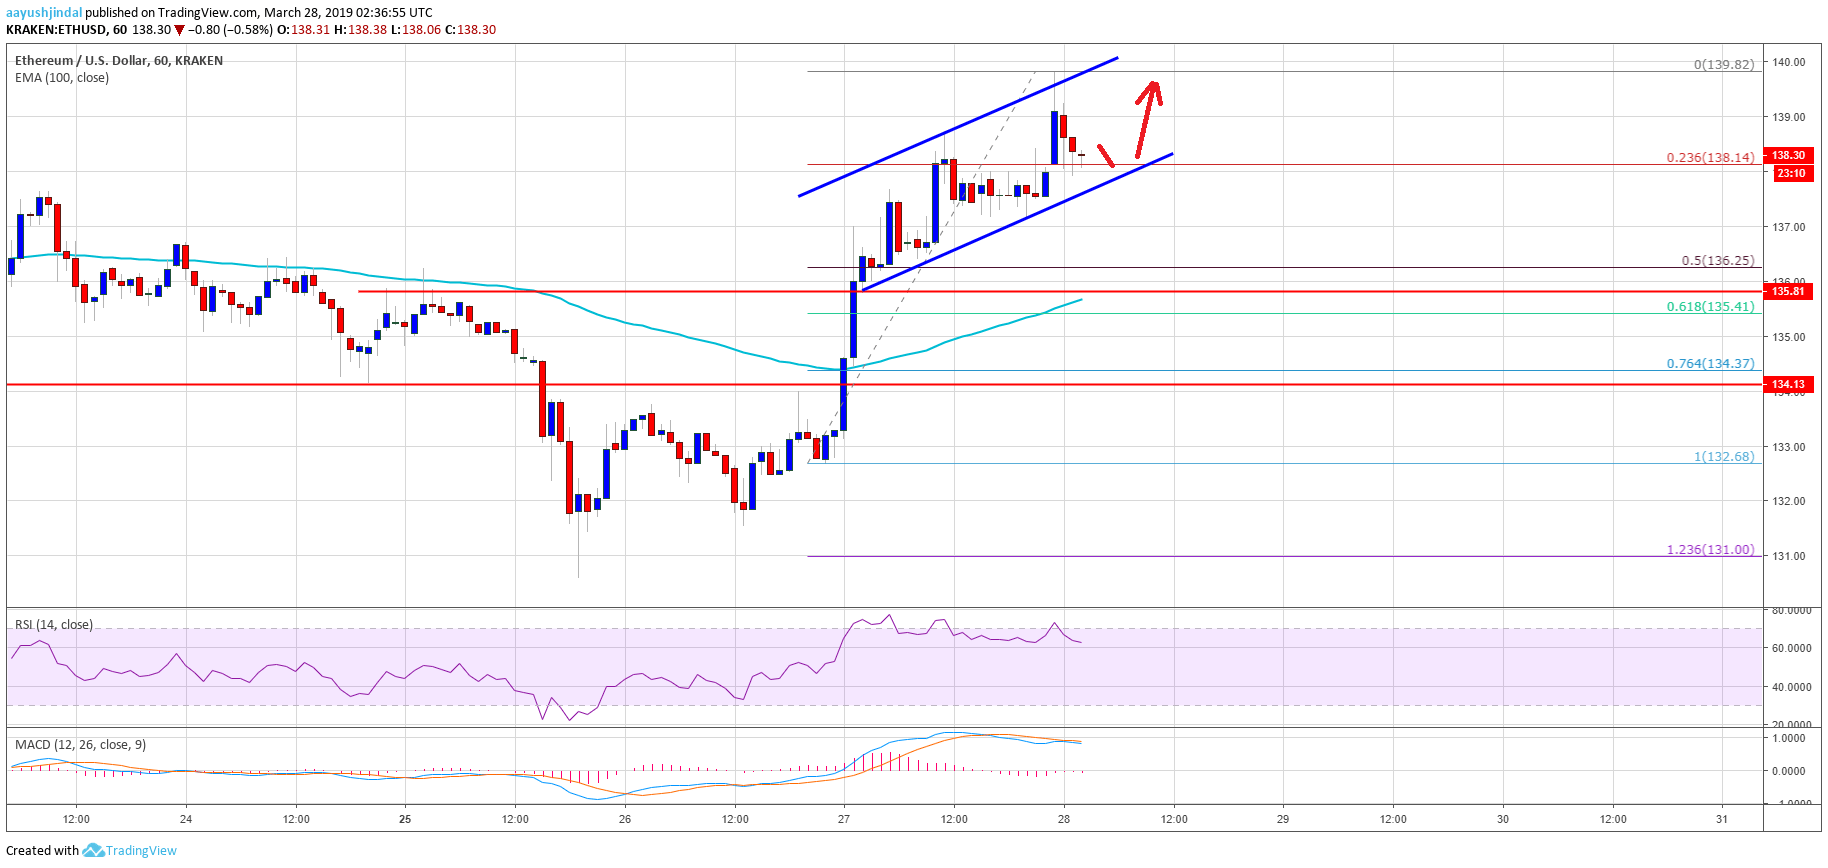
Looking at the chart, ETH price seems to be following a nice uptrend above the $138 and $136 support levels. Once there is a break above the $140 barrier, the price is likely to test the $144-145 resistance area. On the downside, if there is a break below the $138 support, buyers are likely to take a stand near the $136 level.
ETH Technical Indicators
Hourly MACD – The MACD for ETH/USD is about to move back in the bullish zone.
Hourly RSI – The RSI for ETH/USD is currently correcting lower from the 70 level.
Major Support Level – $136
Major Resistance Level – $140