
Reason to trust
How Our News is Made
Strict editorial policy that focuses on accuracy, relevance, and impartiality
Ad discliamer
Morbi pretium leo et nisl aliquam mollis. Quisque arcu lorem, ultricies quis pellentesque nec, ullamcorper eu odio.
- Bitcoin price extended gains above the $4,000 level and tested $4,040 against the US Dollar.
- The price started a downside correction after trading as high as $4,037.
- There was a break below a short term bullish trend line with support at $4,015 on the hourly chart of the BTC/USD pair (data feed from Kraken).
- The pair might correct lower, but dips remain attractive to buyers near the $3,970 support area.
Bitcoin price traded with a bullish bias above the $4,000 level against the US Dollar. BTC is currently correcting lower, but dips are likely to find a strong buying interest near $3,970 or $3,940.
Bitcoin Price Analysis
Yesterday, we saw a solid rise in bitcoin price above the $3,900 and $3,940 resistance levels against the US Dollar. The BTC/USD pair even broke the $4,000 resistance and settled above the 100 hourly simple moving average. The upward move was strong as the price climbed above the $4,020 resistance level. A new weekly high was formed at $4,037 and later the price started a downside correction. It traded below the $4,020 and $4,010 support levels.
Besides, there was a break below a short term bullish trend line with support at $4,015 on the hourly chart of the BTC/USD pair. The pair surpassed the 23.6% Fib retracement level of the recent wave from the $3,909 low to $4,037 high. However, there are many supports on the downside near the $3,980 and $3,970 levels. Besides, the 50% Fib retracement level of the recent wave from the $3,909 low to $4,037 high is also near the $3,973 level. If there are more losses, the next key support is near the $3,660 level.
The $3,660 can be a pivot level since it is the 61.8% Fib retracement level of the recent wave from the $3,909 low to $4,037 high. On the upside, the $4,020 level is an initial resistance for buyers. A clear break above $4,020 may open the doors for a push above the $4,040 and $4,050 resistance levels.
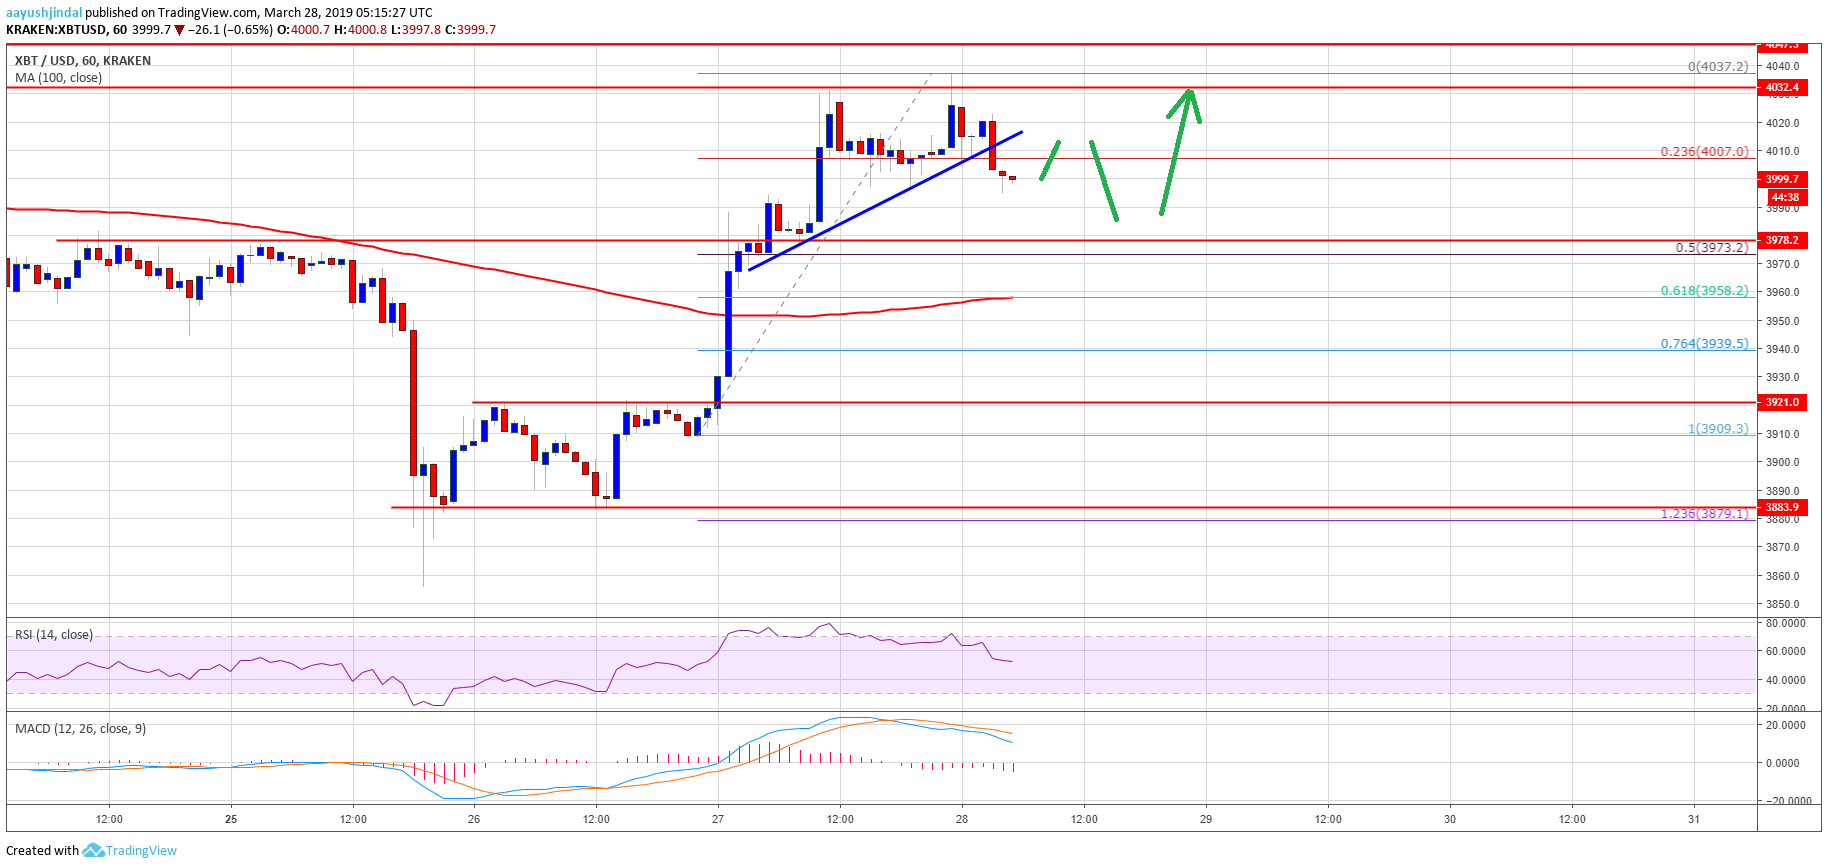
Looking at the chart, bitcoin price is placed nicely in an uptrend above the $3,970 and $3,960 support levels. Any further losses may push the price back in a bearish zone towards the $3,920 support. An intermediate support is near the $3,940 level, which was a key resistance earlier. Overall, the current technical structure is positive and there are chances of more gains once the current correction is complete near $3,970 or $3,960.
Technical indicators:
Hourly MACD – The MACD is slowly gaining pace in the bearish zone.
Hourly RSI (Relative Strength Index) – The RSI for BTC/USD is currently correcting lower towards the 50 level.
Major Support Levels – $3,970 followed by $3,960.
Major Resistance Levels – $4,010, $4,020 and $4,040.