Reason to trust
How Our News is Made
Strict editorial policy that focuses on accuracy, relevance, and impartiality
Ad discliamer
Morbi pretium leo et nisl aliquam mollis. Quisque arcu lorem, ultricies quis pellentesque nec, ullamcorper eu odio.
- Ripple price recovered recently, but it failed to break the $0.3120 resistance against the US dollar.
- The price is slowly declining and it is currently trading well below the $0.3100 level.
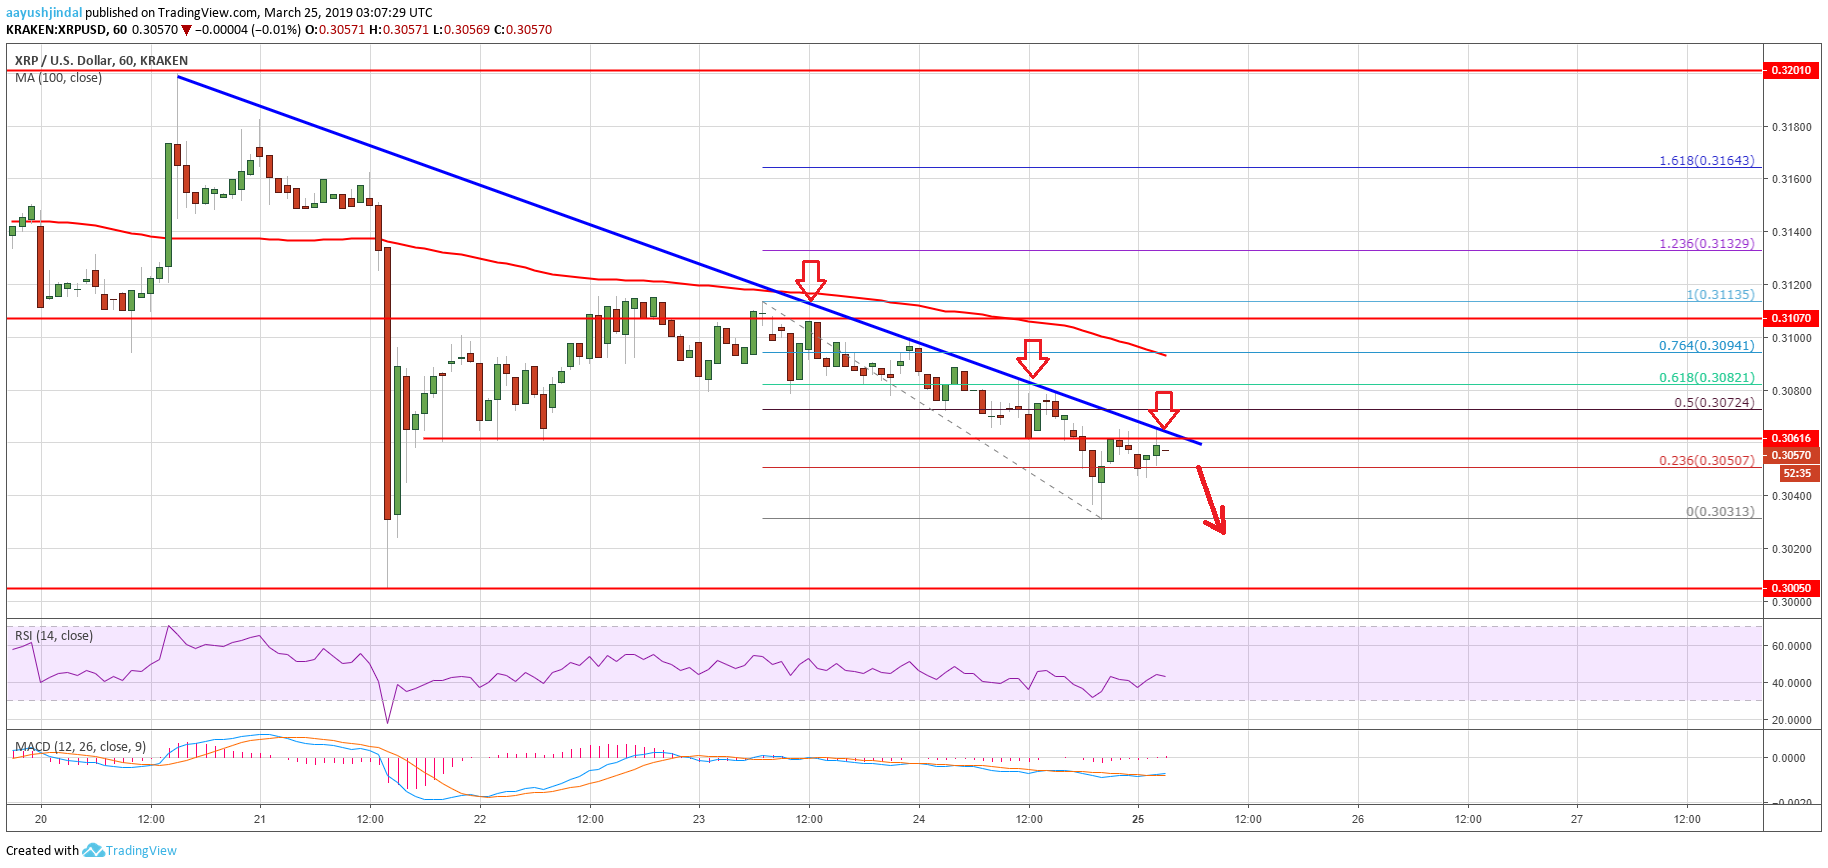
- There is a crucial bearish trend line formed with resistance at $0.3065 on the hourly chart of the XRP/USD pair (data source from Kraken).
- The pair might continue to slide and it could revisit the $0.3020 support level in the near term.
Ripple price is currently under pressure against the US Dollar and bitcoin. XRP/USD is facing a strong resistance near $0.3070 and it may extend its decline towards $0.3020.
Ripple Price Analysis
After testing the $0.3000 support, ripple price started a short term rebound against the US Dollar. The XRP/USD pair traded above the $0.3050 and $0.3080 resistance levels. The price even traded above the $0.3100 level, but it faced a strong resistance near the $0.3120 level. Besides, the price even failed to test the $0.3120 level and the 100 hourly simple moving average. A high was formed at $0.3113 and later the price started a downside move.
It traded below the $0.3080 and $0.3060 support levels. A low was formed at $0.3031 and the price is currently correcting higher. It is trading above the 23.6% Fib retracement level of the last decline from the $0.3113 high to $0.3031 low. However, the previous support near the $0.3060 level is acting as a resistance. There is also a crucial bearish trend line formed with resistance at $0.3065 on the hourly chart of the XRP/USD pair.
Above the trend line, the next resistance is near the $0.3080 level. It coincides with the 61.8% Fib retracement level of the last decline from the $0.3113 high to $0.3031 low. However, the main resistance is near the $0.3100 level and the 100 hourly SMA. Therefore, even if the price breaks the $0.3065 resistance, it is likely to struggle near $0.3080 or $0.3100. On the downside, an immediate support is near the $0.3030 level, below which the price may revisit the $0.3020 support level.
Looking at the chart, ripple price is clearly trading near important resistances near $0.3060 and $0.3070. There may be a short term upside break, but the price remains in a bearish zone as long as it is below $0.3100. On the downside, if there is a break below the $0.3020 support, there could be heavy losses towards $0.3000 or $0.2920.
Technical Indicators
Hourly MACD – The MACD for XRP/USD is slightly placed in the bullish zone.
Hourly RSI (Relative Strength Index) – The RSI for XRP/USD is currently just above the 40 level.
Major Support Levels – $0.3030, $0.3020 and $0.3000.
Major Resistance Levels – $0.3065, $0.3080 and $0.3100.