
Reason to trust
How Our News is Made
Strict editorial policy that focuses on accuracy, relevance, and impartiality
Ad discliamer
Morbi pretium leo et nisl aliquam mollis. Quisque arcu lorem, ultricies quis pellentesque nec, ullamcorper eu odio.
- Bitcoin price traded to a new monthly high at $4,064 and later corrected lower against the US Dollar.
- The price declined sharply below $3,950, but dips remained supported above $3,900.
- There is a crucial bullish trend line formed with support at $3,920 on the 4-hours chart of the BTC/USD pair (data feed from Kraken).
- The pair remains well supported on dips near the $3,920 level and the 100 simple moving average (4-hours).
Bitcoin price is still in a strong uptrend despite recent bearish moves against the US Dollar. BTC/USD is likely to find a solid buying interest if it dips towards $3,940 or $3,920.
Bitcoin Price Weekly Analysis (BTC)
This past week, there was a decent upward move above $4,000 in bitcoin price against the US Dollar. The BTC/USD pair traded in a range above the $3,940 support level and finally broke the $4,000 resistance level. Buyers pushed the price above the $4,020 resistance and a new monthly high was formed at $4,064. However, buyers failed to hold gains above $4,020, resulting in a sharp decline below $4,000. The price dropped heavily and broke the $3,960 and $3,940 support levels.
There was even a spike below the $3,900 support and the 100 simple moving average (4-hours). Having said that, buyers defended the $3,900 support and the price bounced back sharply above $3,940. There was a break above the 50% Fib retracement level of the last decline from the $4,064 high to $3,869 low. The recent recovery was solid, but the price faced a strong offer zone near the $4,000 resistance. The 61.8% Fib retracement level of the last decline from the $4,064 high to $3,869 low also acted as a hurdle.
At the moment, the price is consolidating below the $4,000 resistance. Besides, there is a short term connecting bearish trend line in place with resistance at $3,990 on the 4-hours chart of the BTC/USD pair. A clear break above the trend line and $4,000 could open the doors for a fresh upward move. On the downside, there are many supports near the $3,940 and $3,920 levels. There is also a crucial bullish trend line forming with support at $3,920 on the same chart.
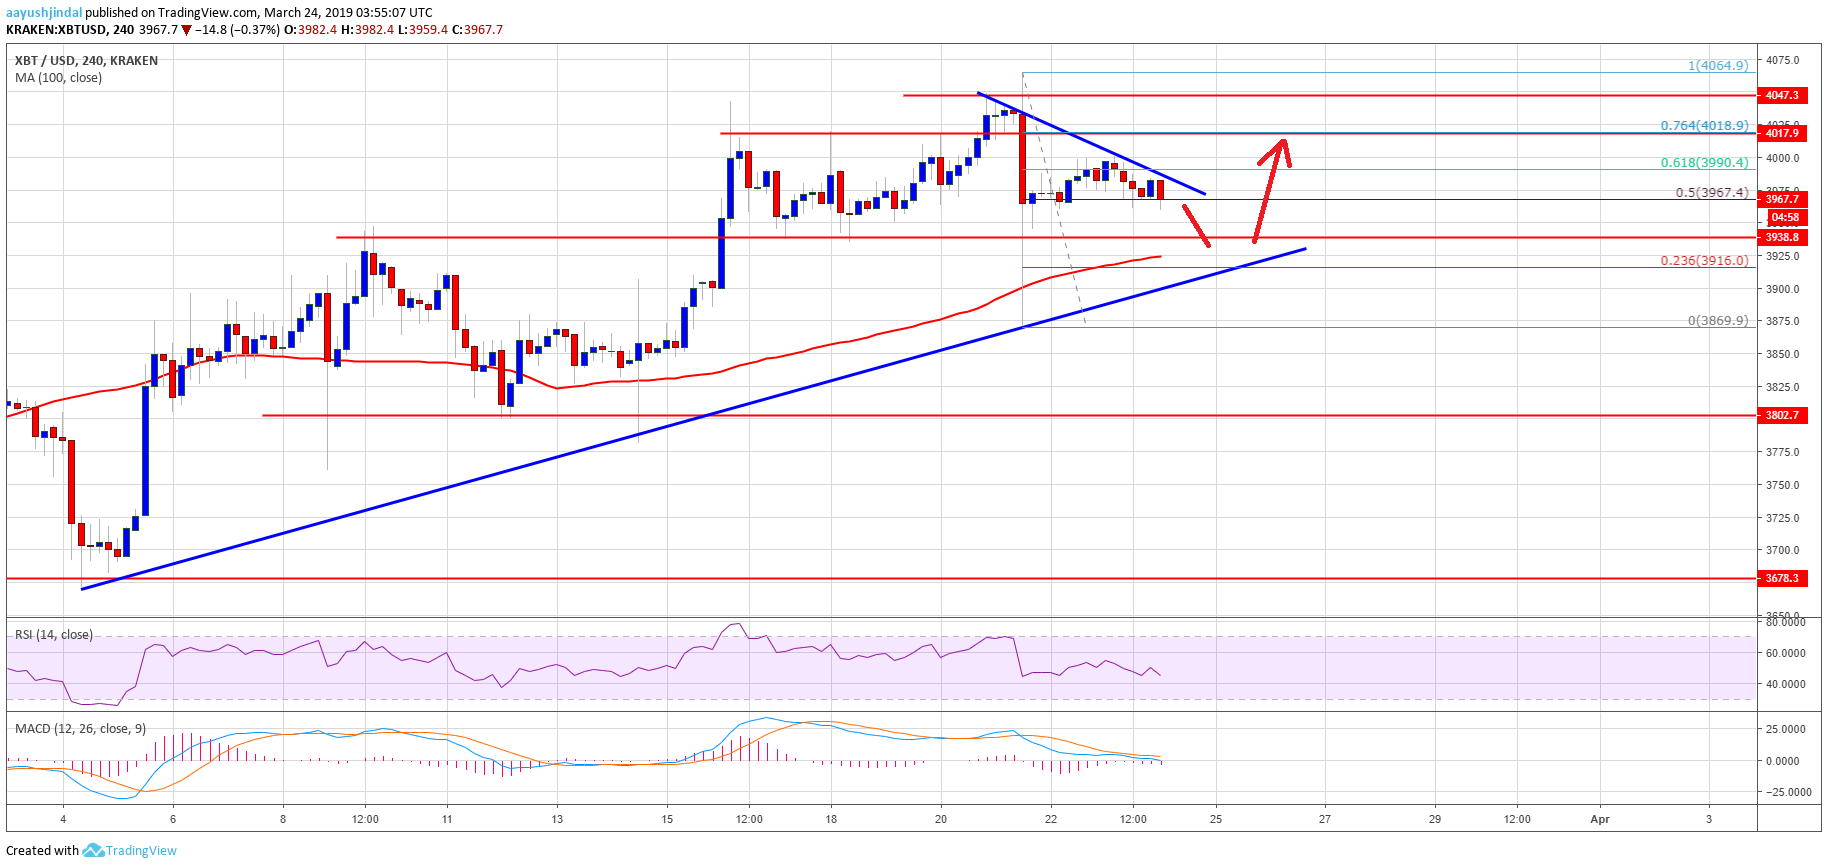
Looking at the chart, BTC price is clearly well supported on the downside near the $3,940 and $3.920 levels. As long as the price is above the $3,900 support and the 100 SMA, there are chances of a steady rise in the coming sessions. Buyers may wait for a clear break above the $4,000 and $4,020 resistance levels to gain control.
Technical indicators
4 hours MACD – The MACD for BTC/USD is slightly placed in the bearish zone.
4 hours RSI (Relative Strength Index) – The RSI for BTC/USD is currently well below the 50 level.
Major Support Level – $3,900
Major Resistance Level – $4,020