Reason to trust

How Our News is Made
Strict editorial policy that focuses on accuracy, relevance, and impartiality
Ad discliamer
Morbi pretium leo et nisl aliquam mollis. Quisque arcu lorem, ultricies quis pellentesque nec, ullamcorper eu odio.
- Bitcoin Price stable but under pressure
- Bitwise research concludes that 95 percent of exchanges’ volumes fake
- Transaction volumes shrink after Mar 21
It’s a sequel of damaging news. Days after SEC revealed the public’s apprehension of Bitcoin ETF approval; Bitwise report confirms what Jay Clayton isn’t comfortable with: Exchanges’ manipulation. Even so, Bitcoin volumes are flat as prices consolidate inside Mar 21 high low.
Bitcoin Price Analysis
Fundamentals
Bitwise Asset Management, a private firm behind the first cryptocurrency index fund, Bitwise 10 Private Index Fund, has a damning finding on cryptocurrency trading and exchanges in particular. With interests and in the process of applying for a Bitcoin ETF, the firm did thorough research on exchange’s order book, using the “first-of-its-kind analysis of order book data from all 81 exchanges reporting more than $1 million in BTC volume on CMC.”
Their conclusion found out that “95 percent of volumes are fake.” By concentrating their efforts on CoinMarketCap, the leading cryptocurrency tracker, plagued by claims of leniency and failing to delist exchanges accused of wash trading and other forms of manipulation, the diligence of Bitwise research team found that volume inflation was rampant in “loosely regulated and unregulated exchanges.”
They went on to say the actual trading volume is around $270 million and not even close to the $6 billion relayed by coin trackers. It is this inflation and outright data manipulation that SEC Chairman Jay Clayton says “is uncomfortable with” all because “some thefts around digital assets that make you scratch your head.”
Now that comments after SEC solicitation have been made public and not many—judging from what the commission received from the public—are fond of a Bitcoin ETF. A concerned citizen, D. Barnwell, advised the SEC adopt a “much longer time horizon to take a ‘watch-and-wait approach.’”
Candlestick Arrangement

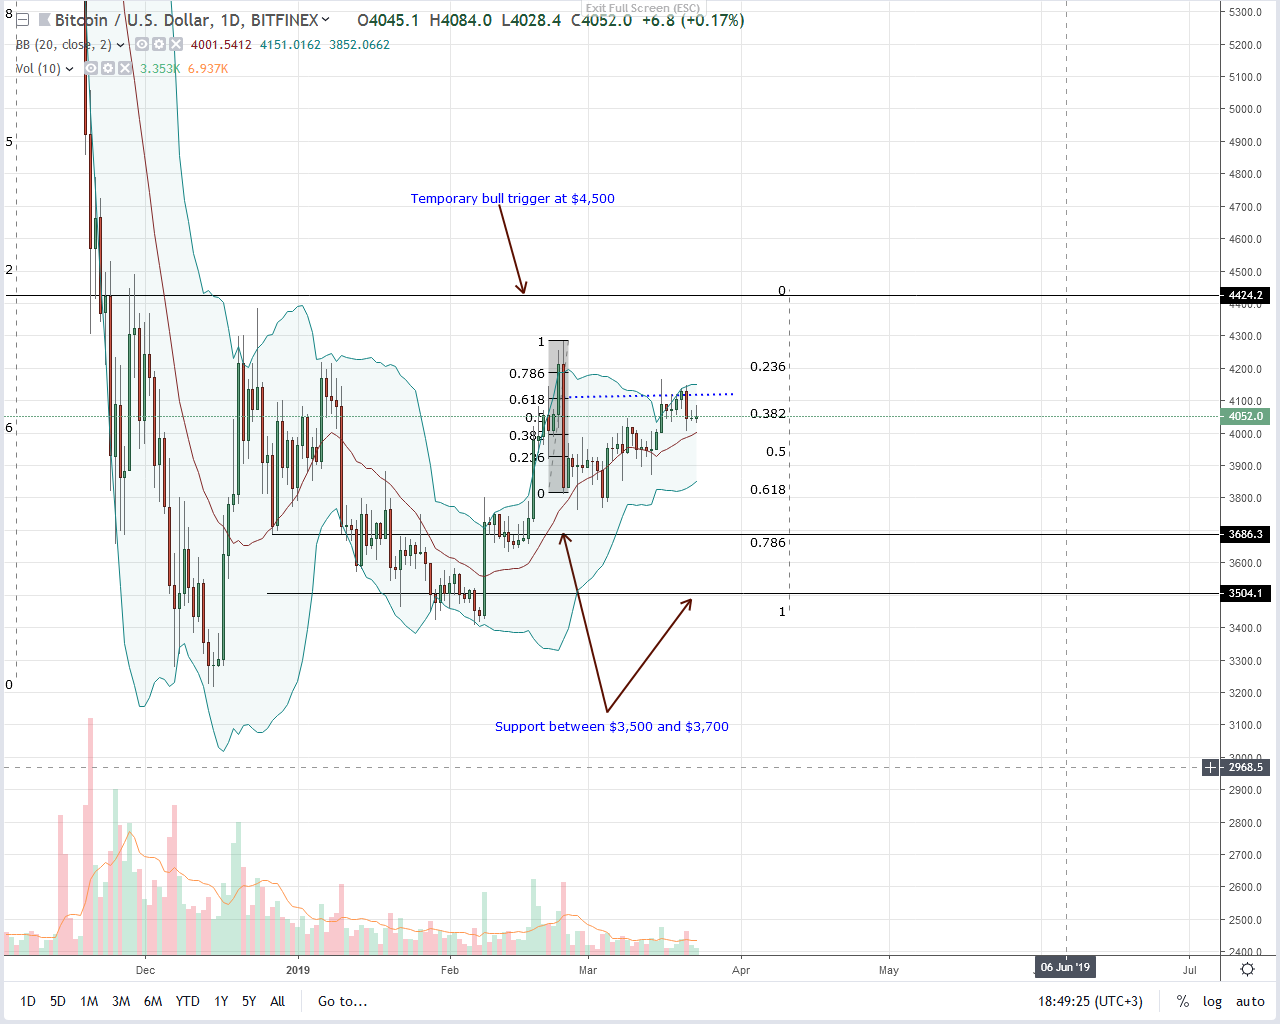
Although Bitcoin (BTC) prices are stable in the last day, the failure of bulls to drive prices above $4,500 should be a concern. Note that $4,500 not only double up as our immediate resistance line. It is also $200 away from Feb 24 highs, our anchor bar.
In any case, our trade plan is valid, and from our technical arrangement, every low should be a buying opportunity. However, if prices break below $3,900 and the accompanying bar is wide-ranging then we may see a meltdown towards $3,500.
Technical Indicators
Our reference bar in the next few days is Mar 16—13k against 7k. Because we have a double bar bear reversal pattern after Mar 21 liquidations—11k against 7k, any confirmation of bears must be with high volumes exceeding 15k. On the flip side, bull trend confirmation towards $4,500 must meet the same trade conditions.
Chart courtesy of Trading View


