
Reason to trust
How Our News is Made
Strict editorial policy that focuses on accuracy, relevance, and impartiality
Ad discliamer
Morbi pretium leo et nisl aliquam mollis. Quisque arcu lorem, ultricies quis pellentesque nec, ullamcorper eu odio.
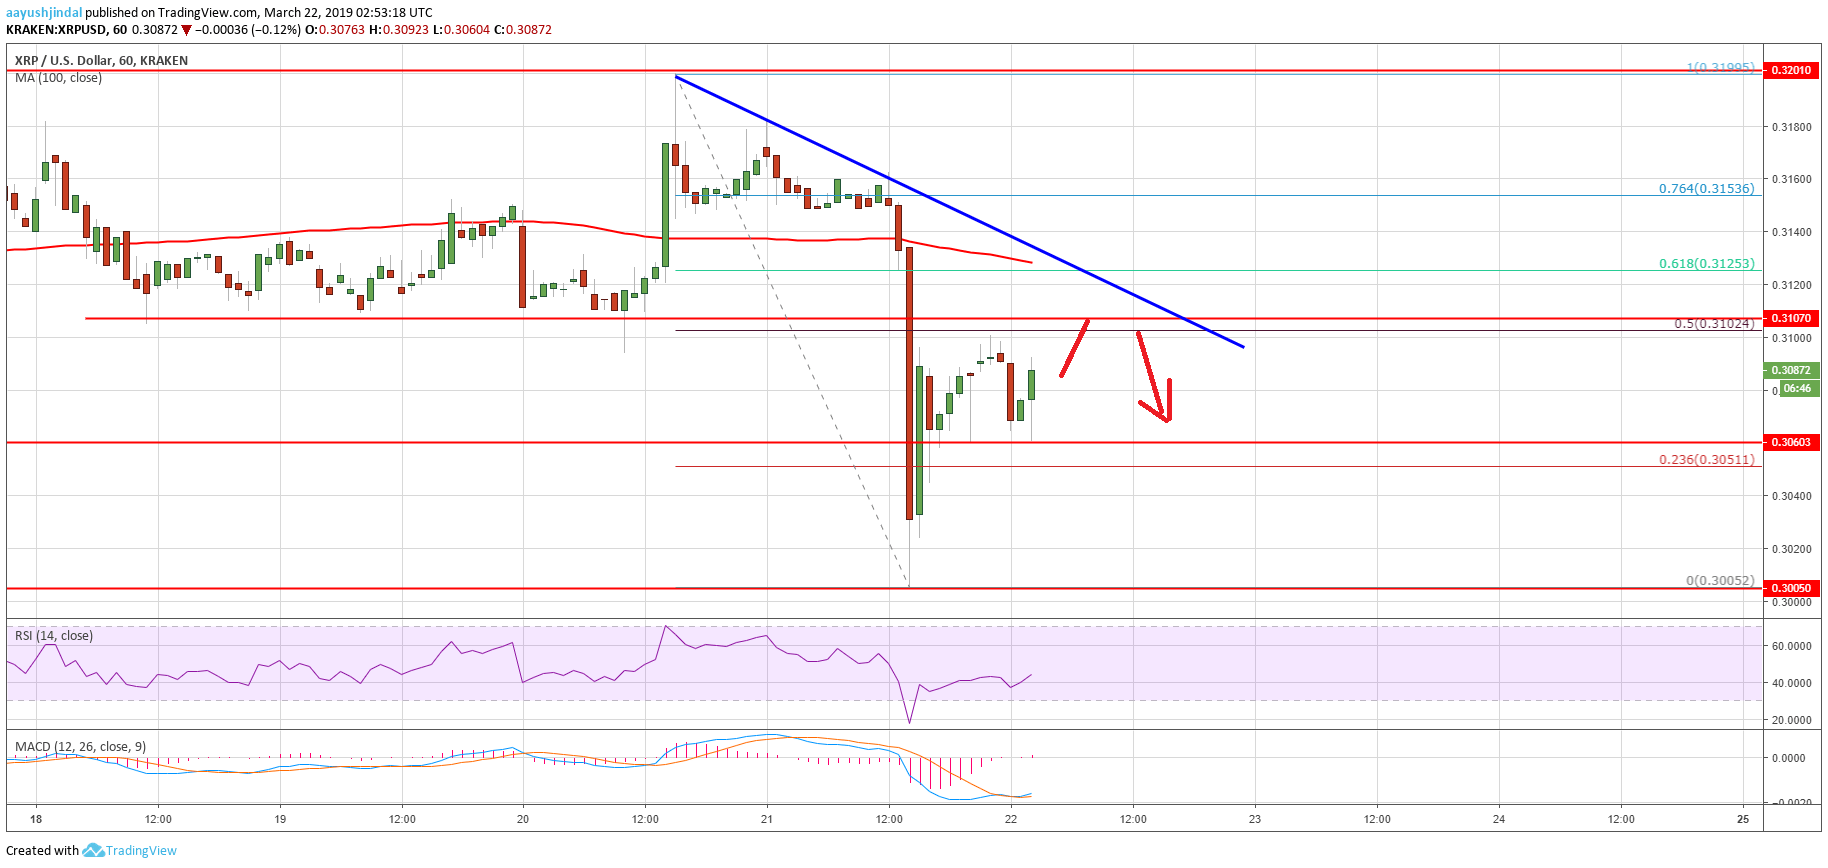
- Ripple price failed once again to break the $0.3200 resistance and declined sharply against the US dollar.
- The price broke the key $0.3125 and $0.3100 support levels to move into a bearish zone.
- There is a major bearish trend line formed with resistance at $0.3110 on the hourly chart of the XRP/USD pair (data source from Kraken).
- The pair is currently correcting higher, but it is facing a solid hurdle near the $0.3100 pivot level.
Ripple price declined heavily and turned bearish against the US Dollar and bitcoin. XRP/USD may consolidate in the short term and upsides are likely to remain capped near $0.3100 and $0.3120.
Ripple Price Analysis
There was another attempt by ripple price to clear the $0.3200 resistance against the US Dollar. The XRP/USD pair failed to gain momentum, resulting in a sharp bearish reaction. The price started a significant decline and broke the $0.3150 and $0.3140 support levels. The decline was such that the price even broke the key $0.3100 support level and the 100 hourly simple moving average. A new weekly low was formed near the $0.3000 level before the price started an upside correction.
Buyers pushed the price above $0.3050 and the 23.6% Fib retracement level of the last drop from the $0.3199 high to $0.3005 low. There was even a break above the $0.3080 resistance, but the price faced a strong resistance near the $0.3100 level. The stated $0.3100 level acted as a support earlier and now it is preventing gains. Besides, the 50% Fib retracement level of the last drop from the $0.3199 high to $0.3005 low is also near the $0.3100 resistance. More importantly, there is a major bearish trend line formed with resistance at $0.3110 on the hourly chart of the XRP/USD pair.
Therefore, the price is likely to face a strong selling interest near the $0.3100 level. The next key resistance is near the $0.3125 level since it coincides with the 100 hourly SMA. On the downside, an initial support is near the $0.3060, below which the price could revisit the $0.3000 support level.
Looking at the chart, ripple price moved into a bearish zone, with a close below $0.3100 and the 100 hourly SMA. In the short term, there could be range moves between $0.3060 and $0.3125 before the price makes the next move. On the downside, if buyers fail to defend the $0.3000 support, the price may slide towards the $0.2920 support.
Technical Indicators
Hourly MACD – The MACD for XRP/USD is slowly moving into the bullish zone.
Hourly RSI (Relative Strength Index) – The RSI for XRP/USD is currently moving higher towards the 45 level.
Major Support Levels – $0.3060, $0.3040 and $0.3000.
Major Resistance Levels – $0.3100, $0.3120 and $0.3125.


