
Reason to trust
How Our News is Made
Strict editorial policy that focuses on accuracy, relevance, and impartiality
Ad discliamer
Morbi pretium leo et nisl aliquam mollis. Quisque arcu lorem, ultricies quis pellentesque nec, ullamcorper eu odio.
- Bitcoin price formed a strong support near the $3,940 level and climbed higher against the US Dollar.
- The price managed to clear the $3,965 and $3,980 resistance levels to move into a positive zone.
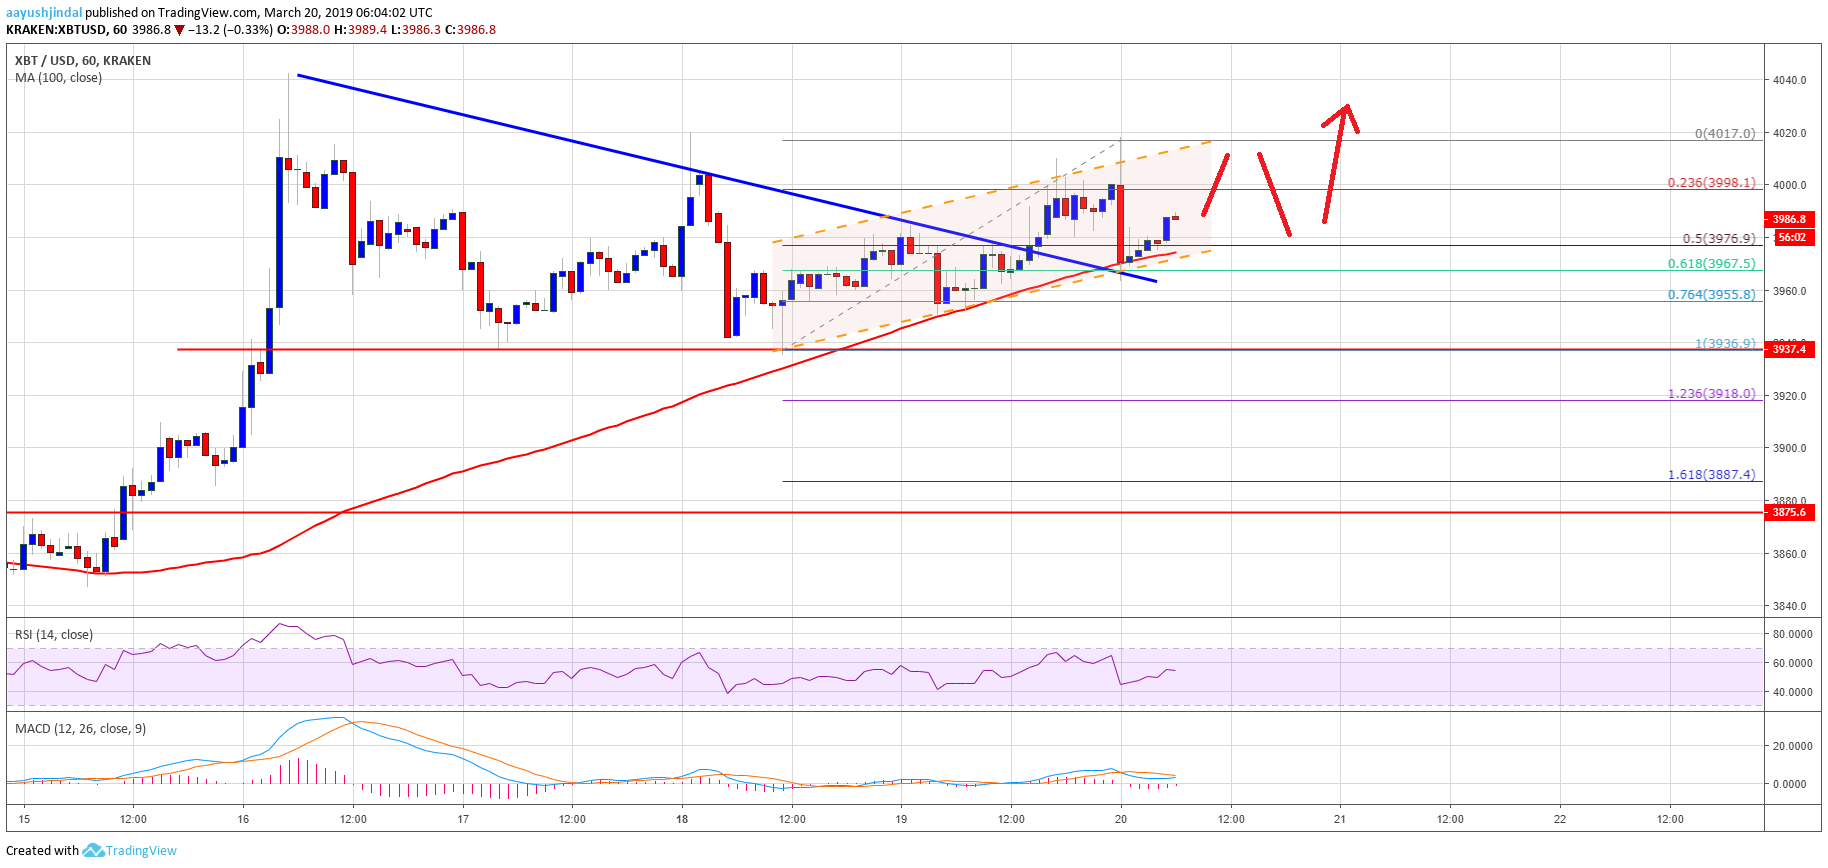
- Yesterday’s highlighted key bearish trend line was breached with resistance at $3,970 on the hourly chart of the BTC/USD pair (data feed from Kraken).
- The current price action is positive, but buyers need to gain strength above the $4,000 resistance.
Bitcoin price started a slow and steady rise against the US Dollar. BTC is showing positive signs and it seems like there could be an upside extension above the $4,000 and $4,040 levels.
Bitcoin Price Analysis
Recently, we saw a downside correction in bitcoin price below the $4,000 support against the US Dollar. The BTC/USD pair declined below the $3,980 and $3,960 levels. However, the $3,940 level acted as a strong support along with the 100 hourly simple moving average. Later, a solid support base was formed above $3,940 and the price slowly moved higher. It broke the $3,960 resistance and the 50% Fib retracement level of the last slide from the $4,041 high to $3,935 swing low.
More importantly, yesterday’s highlighted key bearish trend line was breached with resistance at $3,970 on the hourly chart of the BTC/USD pair. The pair climbed above the $3,980 level to move into a positive zone. It traded above the $4,000 level and formed a high at $4,017 before correcting lower. There was a push below the 50% Fib retracement level of the last wave from the $3,836 low to $4,014 high. However, the price seems to be following an ascending channel with support at $3,965.
Besides, the 61.8% Fib retracement level of the last wave from the $3,836 low to $4,014 high is also near $3,965. Finally, the 100 hourly SMA is also positioned near the $3,960 support area. Therefore, the price could climb higher as long as it is above $3,960. An initial resistance is at $4,020, above which the price may test the $4,040 resistance.
Looking at the chart, bitcoin price is slowly gaining bullish momentum above the $3,980 level. However, BTC buyers need to gain strength above $4,020 and $4,040 to sustain the recent trend. Conversely, if there is a downside break below $3,960, the price could decline towards the 3,940 support. Any further losses might call for a sharp dip towards the $3,875 support in the near term.
Technical indicators:
Hourly MACD – The MACD is about to move into the bullish zone.
Hourly RSI (Relative Strength Index) – The RSI for BTC/USD moved above the 50 level and it is moving higher towards 60.
Major Support Levels – $3,960 followed by $3,940.
Major Resistance Levels – $4,000, $4,020 and $4,040.


