Reason to trust
How Our News is Made
Strict editorial policy that focuses on accuracy, relevance, and impartiality
Ad discliamer
Morbi pretium leo et nisl aliquam mollis. Quisque arcu lorem, ultricies quis pellentesque nec, ullamcorper eu odio.
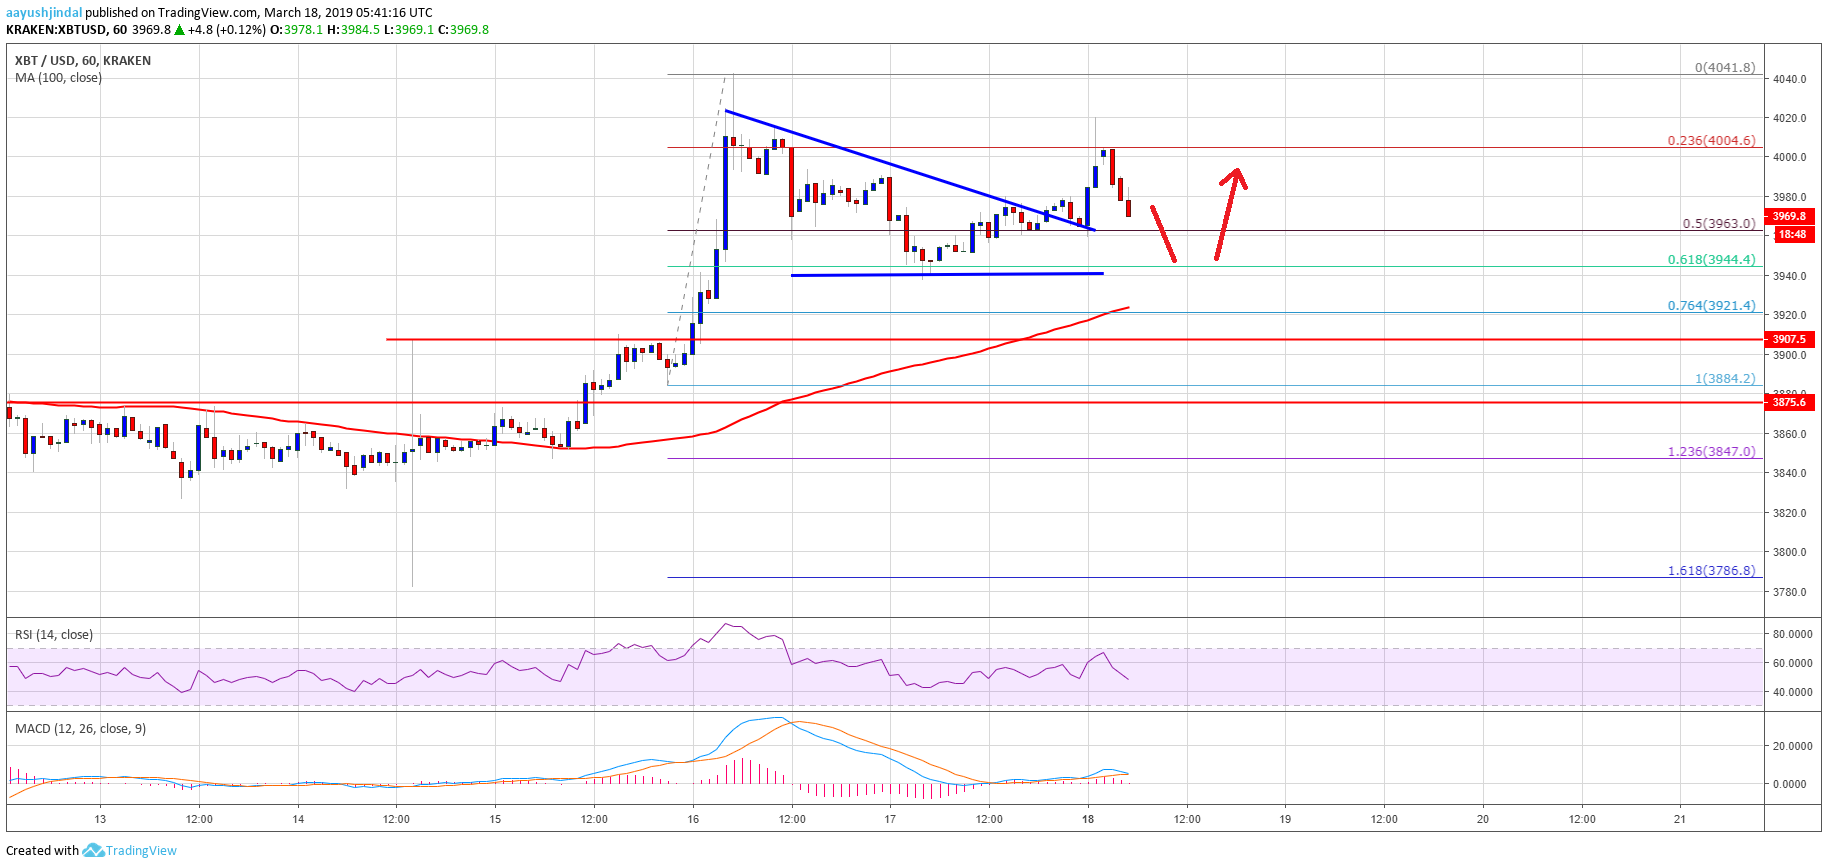
- Bitcoin price climbed higher towards the $4,040 level before correcting lower against the US Dollar.
- The price declined below $4,000 and tested the key $3,940 support area.
- Recently, there was a break above a connecting bearish trend line with resistance at $3,970 on the hourly chart of the BTC/USD pair (data feed from Kraken).
- The pair is currently moving lower, but it remains well supported near $3,940 and $3,920.
Bitcoin price corrected gains recently below $4,000 against the US Dollar. BTC could bounce back as long as it is trading above the $3,900 pivot area in the coming sessions.
Bitcoin Price Analysis
In the weekly analysis, we saw a nice upward move above $4,000 in bitcoin price against the US Dollar. The BTC/USD pair even broke the $4,020 level and traded towards the $4,040 level. A high was formed at $4,041 and later the price corrected lower below $4,020. Sellers pushed the price below the $4,000 and $3,980 levels. There was a break below the 50% Fib retracement level of the last leg from the $3,884 low to $4,041 high.
However, the $3,940 level acted as a strong support and the price stayed well above the 100 hourly simple moving average. Moreover, the 61.8% Fib retracement level of the last leg from the $3,884 low to $4,041 high also acted as a support. Later, the price bounced back above the $3,960 level. There was also a break above a connecting bearish trend line with resistance at $3,970 on the hourly chart of the BTC/USD pair. The pair spiked above the $4,000 level, but it failed to hold gains.
At the moment, it is moving lower towards the $3,940 support level, where buyers are likely to emerge. If there are more losses, the price may find a strong support near the $3,920 level and the 100 hourly SMA. The next key support is at $3,900, which was a crucial resistance earlier. On the upside, an initial resistance is at $3,980 and $4,000. A successful close above the $4,000 barrier may open the doors for more gains above the $4,040 and $4,050 levels.
Looking at the chart, bitcoin price is struggling to stay above the $4,000 level, but it remains well supported on dips. Having said that, if the price fails to stay above $3,920 and $3,900, it could move back in a bearish zone. The next major support is near the $3,850 level.
Technical indicators:
Hourly MACD – The MACD is about to move back in the bearish zone.
Hourly RSI (Relative Strength Index) – The RSI for BTC/USD recently declined below the 50 level, with a bearish angle.
Major Support Levels – $3,940 followed by $3,920.
Major Resistance Levels – $3,980, $4,000 and $4,040.