Reason to trust
How Our News is Made
Strict editorial policy that focuses on accuracy, relevance, and impartiality
Ad discliamer
Morbi pretium leo et nisl aliquam mollis. Quisque arcu lorem, ultricies quis pellentesque nec, ullamcorper eu odio.
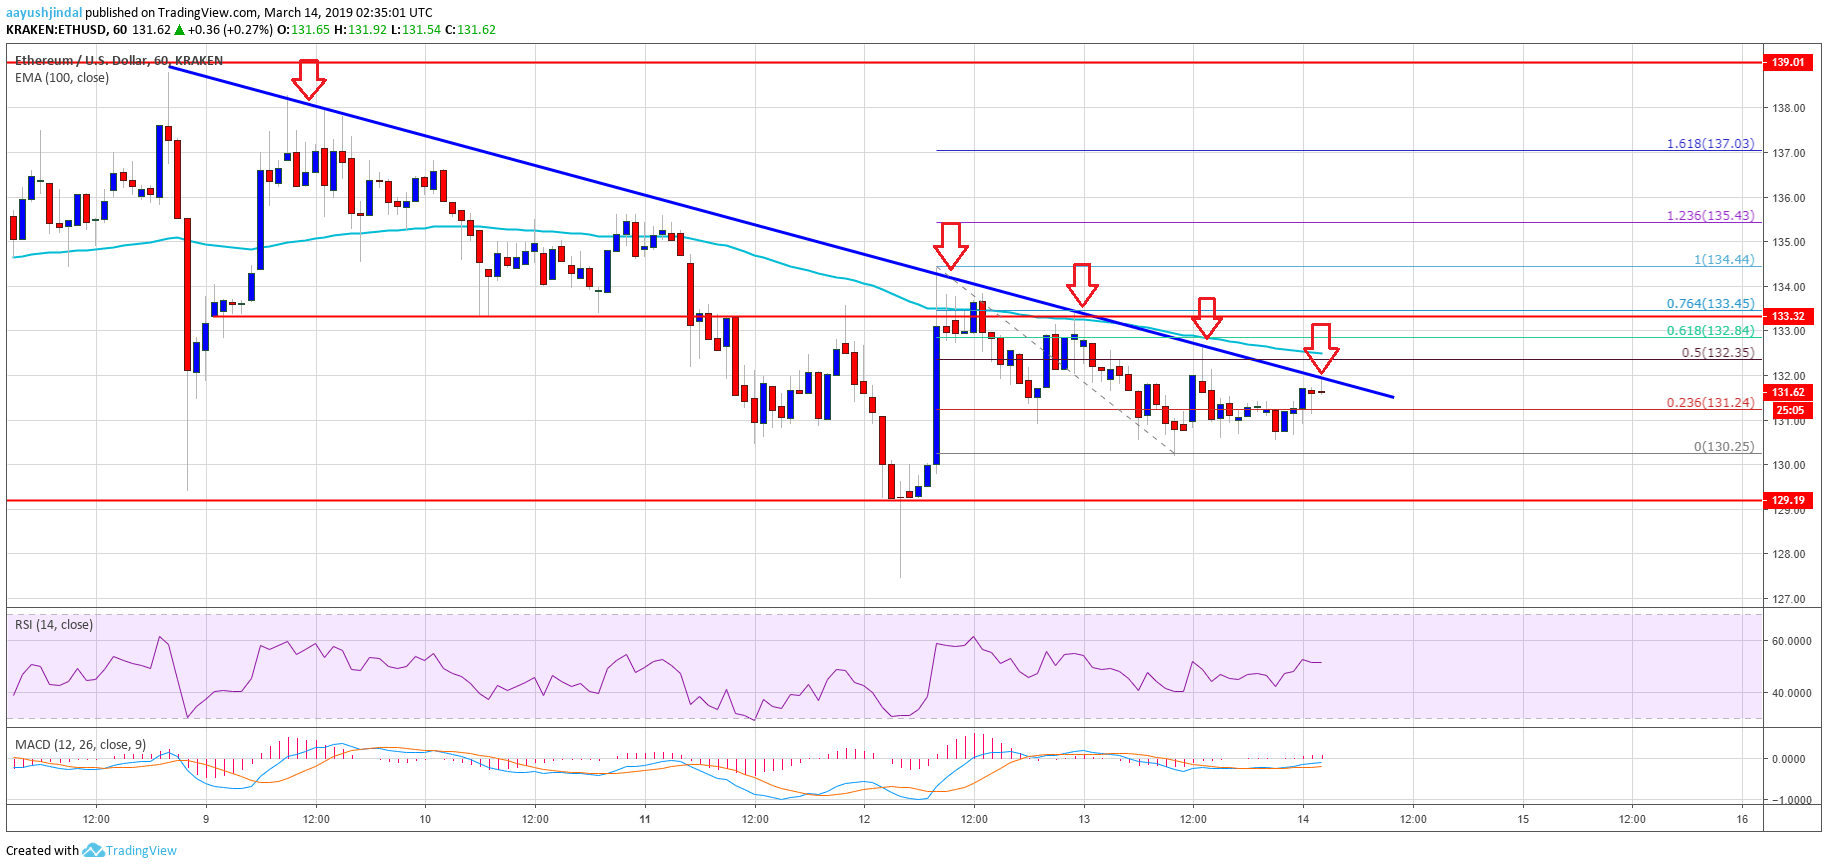
- ETH price is struggling to trade above the $133 and $134 resistance levels against the US Dollar.
- The price is holding the $130 support, it is likely to make the next move soon.
- This week’s crucial bearish trend line is intact with current resistance at $132 on the hourly chart of ETH/USD (data feed via Kraken).
- The pair could either break the trend line and rally or decline below the $130 support in the near term.
Ethereum price is following a bearish structure against the US Dollar and bitcoin. However, if ETH breaks $132 and $134, there could be a decent bullish wave towards the $138 level.
Ethereum Price Analysis
After struggling to break the $134 resistance, ETH price declined steadily against the US Dollar. The ETH/USD pair traded below the $132 support and settled well below the 100 hourly simple moving average. It even broke the 50% Fib retracement level of the last swing wave from the $127 low to $134 high. The price traded close to the $130 support level, where buyers emerged. There was a minor upside correction above the $131 level and the 23.6% Fib retracement level of the recent decline from the $134 high to $130 low.
However, the upside move remains capped by the $132 level and the 100 hourly simple moving average. More importantly, this week’s crucial bearish trend line is intact with current resistance at $132 on the hourly chart of ETH/USD. The trend line is close to the 50% Fib retracement level of the recent decline from the $134 high to $130 low. Clearly, the $132-133 resistance area is very crucial and it could be spark the next move.
The next move in ETH could be either above the $132 and $133 resistance levels or below the $130 support. If there is an upside break above $133 and the 100 hourly SMA, the price could climb sharply higher. The next key resistances area near the $135 and $136 levels, followed by $138. On the other hand, a break below the $130 support may push the price towards the $127 support level.
Looking at the chart, ETH price seems to be facing a strong resistance near the $132 level and the 100 hourly SMA. Besides, the $133 and $134 levels are also significant barriers. Therefore, buyers need to put up a strong fight if they have to push the price back in a positive zone.
ETH Technical Indicators
Hourly MACD – The MACD for ETH/USD is slowly moving back in the bullish zone.
Hourly RSI – The RSI for ETH/USD managed to move above the 50 level, with a positive bias and angle.
Major Support Level – $130
Major Resistance Level – $133