Reason to trust
How Our News is Made
Strict editorial policy that focuses on accuracy, relevance, and impartiality
Ad discliamer
Morbi pretium leo et nisl aliquam mollis. Quisque arcu lorem, ultricies quis pellentesque nec, ullamcorper eu odio.
- Bitcoin price stayed above the $3,800 support area and recovered recently against the US Dollar.
- The price is trading above the $3,840 level and facing a strong resistance near the 100 hourly SMA.
- There is a key bearish trend line in place with resistance at $3,865 on the hourly chart of the BTC/USD pair (data feed from Kraken).
- The pair could rally sharply if there is a close above $3,880 and the 100 hourly SMA.
Bitcoin price rebounded nicely from the $3,800 support against the US Dollar. BTC is currently sighting an upside break above the $3,880 resistance and the 100 hourly SMA.
Bitcoin Price Analysis
Yesterday, we saw a downside reaction below the $3,860 support in bitcoin price against the US Dollar. The BTC/USD pair tested the key $3,800 support level and later started an upside correction. A swing low was formed at $3,801 and the price corrected above the $3,840 level. Buyers were successful in pushing the price above the $3,850 resistance as well. Besides, there was a break above the 50% Fib retracement level of the recent drop from the $3,910 swing high to $3,800 swing low.
However, the recovery faced a strong resistance near the $3,880 level and the 100 hourly simple moving average. More importantly, there is a key bearish trend line in place with resistance at $3,865 on the hourly chart of the BTC/USD pair. The pair also struggled to clear the 61.8% Fib retracement level of the recent drop from the $3,910 swing high to $3,800 swing low. At the moment, the price is consolidating just below the trend line, $3,870, and the 100 hourly SMA.
A successful break above the trend line and $3,880 could really boost the market sentiment. In the mentioned case, the price could climb above the $3,900 and $3,920 resistance levels. The next stop could be $3,960 or even $4,000. On the flip side, if there is a downside correction, the price may find buyers near the $3,840 level. The main support is near the $3,820 and $3,800 levels. If there is a downside break below $3,800, the price could move into a bearish zone in the near term.
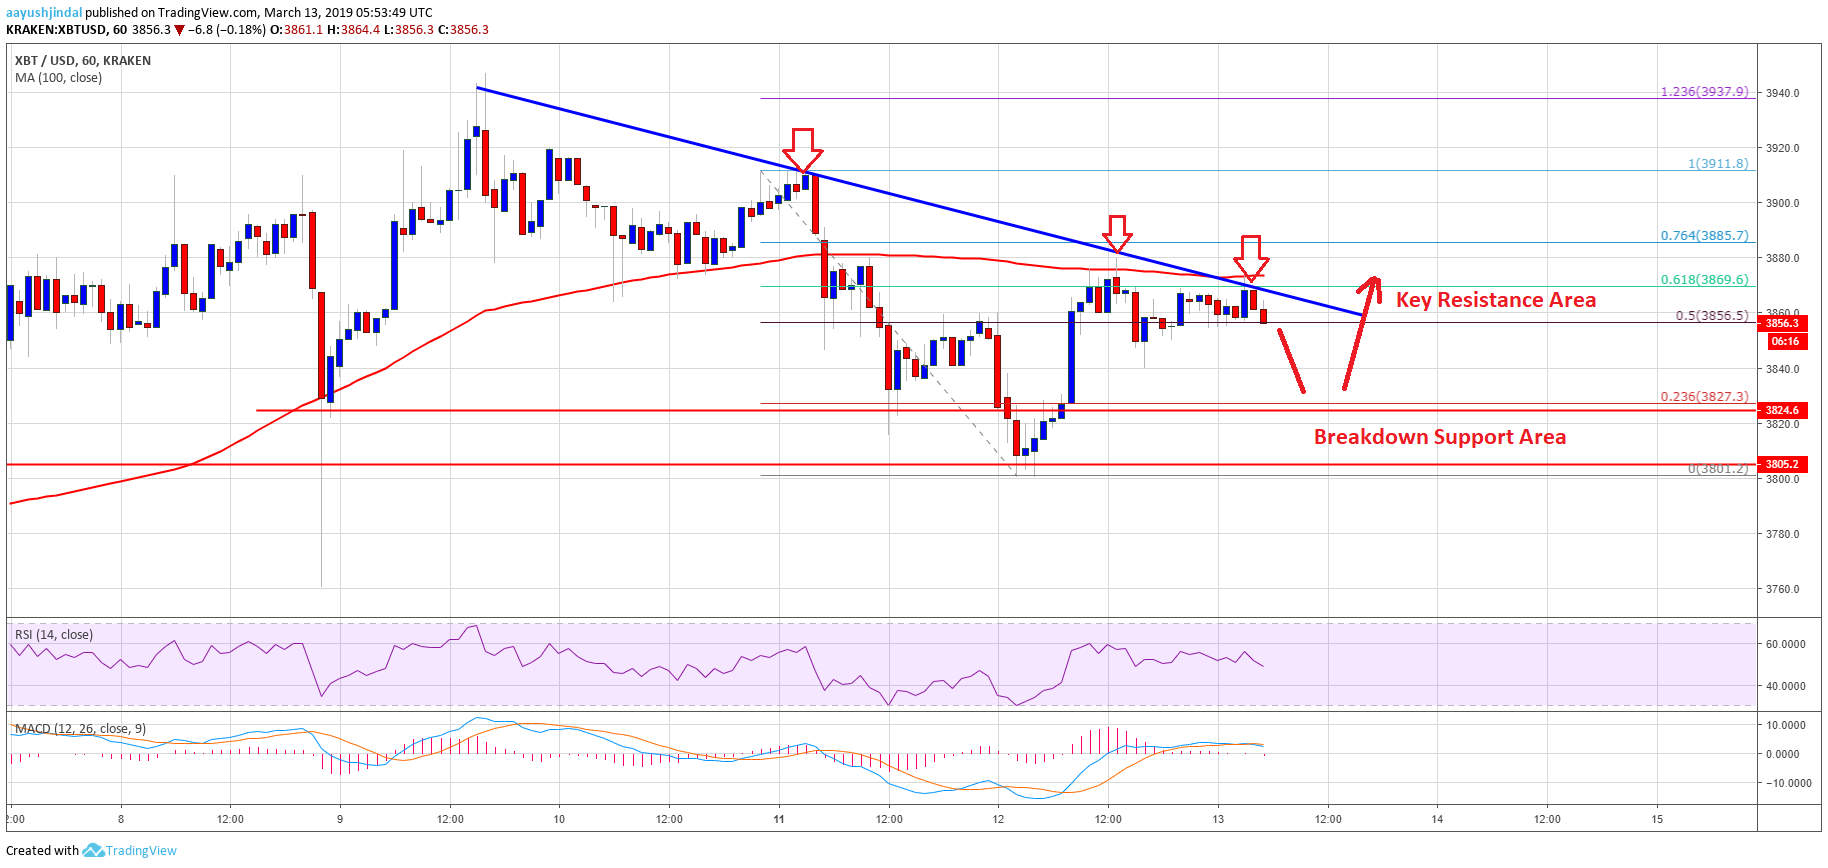
Looking at the chart, bitcoin price seems to be preparing for a larger upside break above $3,880. Having said that, it won’t be easy for buyers to gain traction above $3,880 level and the 100 hourly simple moving average.
Technical indicators:
Hourly MACD – The MACD is placed is about to move into the bullish zone.
Hourly RSI (Relative Strength Index) – The RSI for BTC/USD is currently above the 50 level, with a bullish angle.
Major Support Levels – $3,840 followed by $3,800.
Major Resistance Levels – $3,865, $3,880 and $3,900.