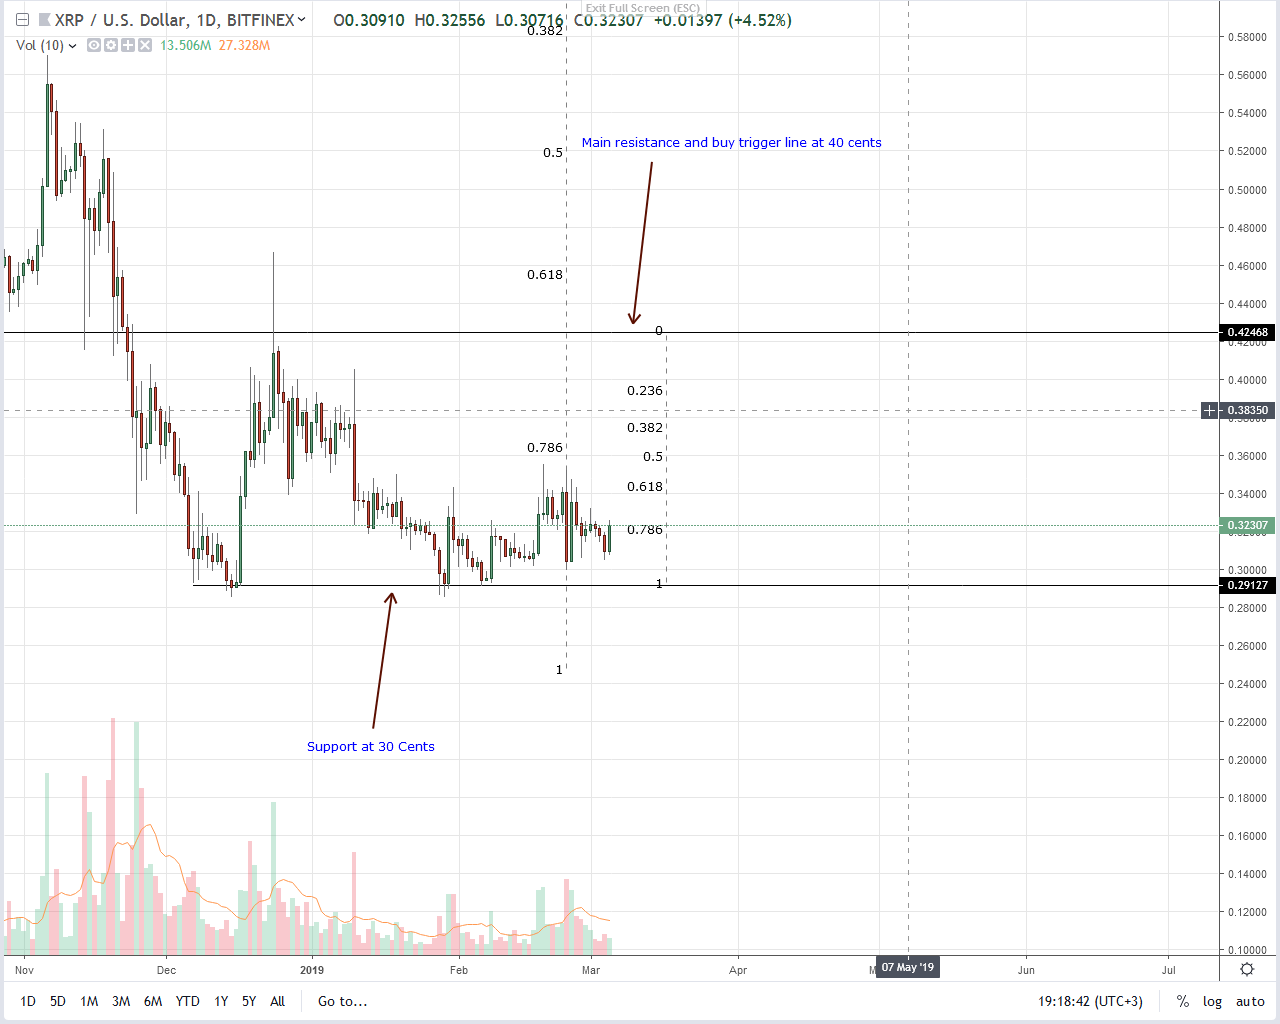
- Ripple price in an uptrend, trading below 34 cents
- Regulatory clarity will clear the air catalyzing adoption
- Average transaction volumes are high, doubles in last month
Even though Ripple related news is scarce, increasing participation levels point to an accumulation. To that end, we expect today’s double bar bull reversal pattern off 30 cents to act as a base for further higher highs in coming days.
Ripple Price Analysis
Fundamentals
Progress is visible. They may be baby steps, but still, it is a step in the right direction. Of the more than 15,000 banks, 200 banks use the Ripple Net. What’s more? 13 out of these 200 banks leverage xRapid, a Ripple Inc option that leverages XRP as liquidity apparatus.
To the ordinary, this is miniscule incomparable to the behemoth in SWIFT. The banker’s network has more than 10,000 banks, is dominant and Ripple has a long way before they become the leading trusted player.
However, as an upcoming start-up, ranked one of the best to work for, their solution promise speed, efficiency and cost savings. It’s just about everything businesses—including banks, need at these trying times. As a result, we expect Ripple to onboard more banks and processors keen on being a step ahead of competitors once there is regulatory clarity.
Recent listing at CoinBase may boost our confidence that XRP is a utility. However, all cards lie with the US regulator or an agent of the commission. Their comment will clear the air leading to an influx that will undoubtedly push XRP prices higher.
Candlestick Arrangements

In a determined trend, every low should be a buying opportunity. However, unless otherwise bulls build momentum and drive prices above key resistance levels, then we shall maintain a neutral but bullish outlook regardless of our forecast.
From our chart, and as mentioned in previous XRP/USD analysis, 34 cents—the 61.8 percent Fibonacci retracement level of Dec 2018 high low is our next buy trigger line. It is after prices break and close above this 4 cents consolidation that XRP stands to rally with first modest targets at 40 cents.
Breakouts will be consequential and will open the doors for 60 cents and later 80 cents as bulls take charge. Candlestick arrangement point to bulls and in line with surges of Feb 25, odds are north is the path of least resistance.
Technical Indicators
Volumes reveal liquidity and demand. In the daily chart, Feb 24 bear bar stands out. It has high trade volumes—61 million against averages of 28 million. Because of today’s double bar bull reversal pattern, any bar that drives prices above 34 cents must be at the back of high trading volumes—above 28 million and even 61 million.


