
Reason to trust
How Our News is Made
Strict editorial policy that focuses on accuracy, relevance, and impartiality
Ad discliamer
Morbi pretium leo et nisl aliquam mollis. Quisque arcu lorem, ultricies quis pellentesque nec, ullamcorper eu odio.
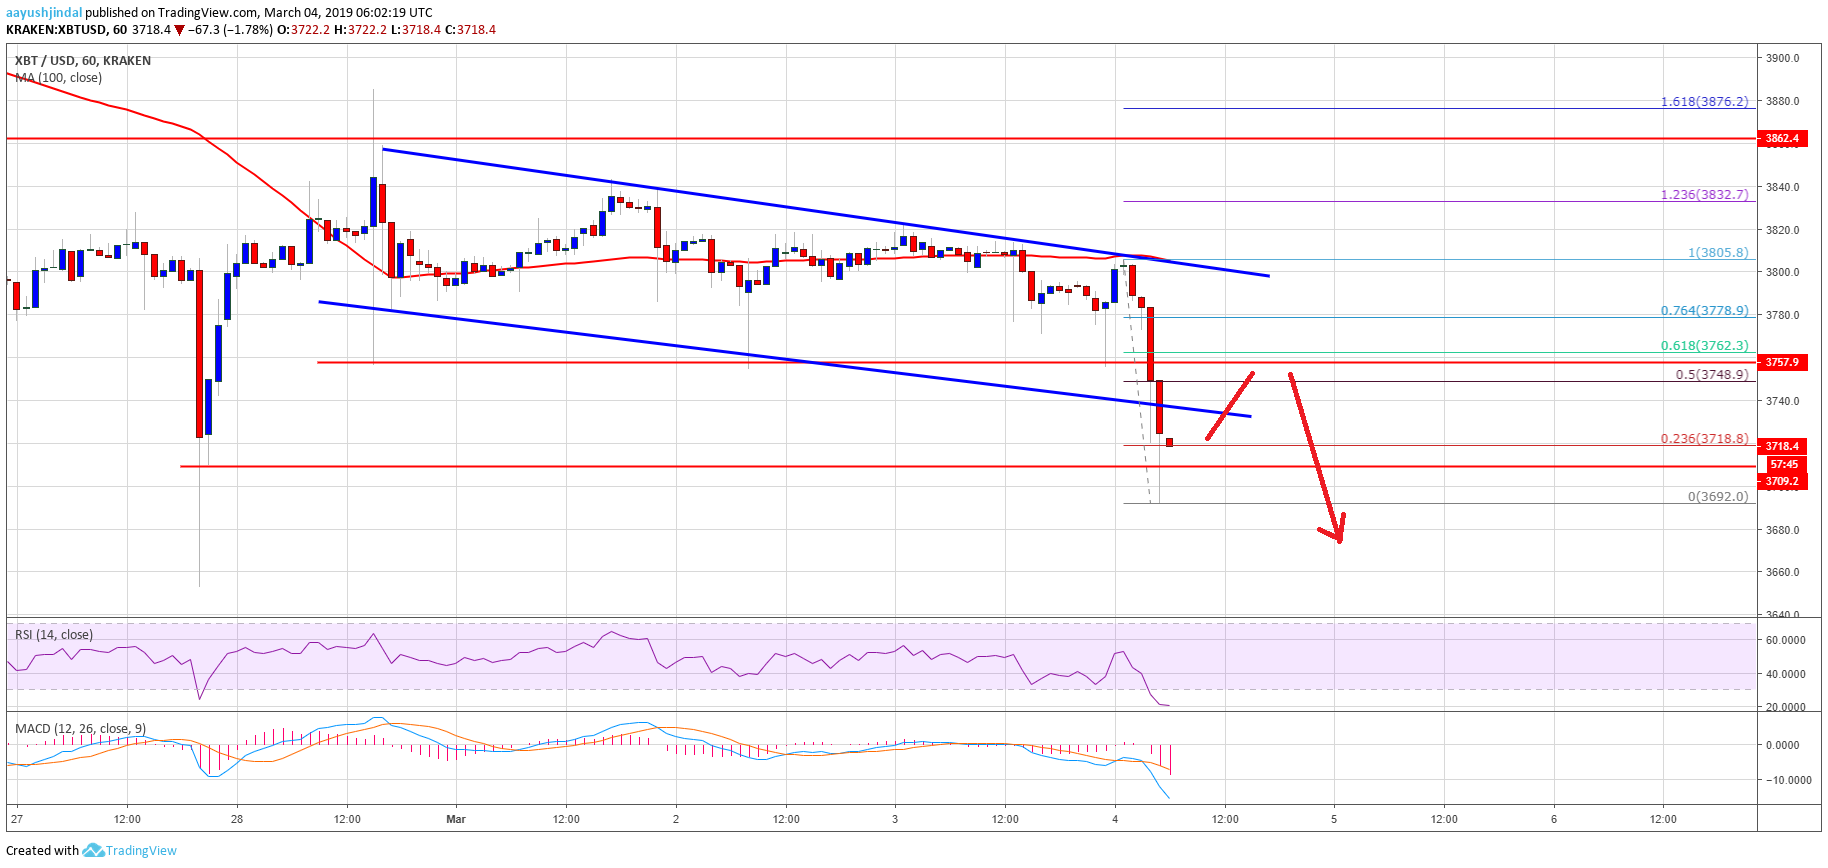
- Bitcoin price failed on many occasions to break the key $3,860 resistance level against the US Dollar.
- The price started a downward move and broke the $3,800 and $3,760 support levels.
- There was a break below a declining channel with resistance at $3,800 on the hourly chart of the BTC/USD pair (data feed from Kraken).
- The pair is trading in a bearish zone and it could decline further below $3,700 and $3,680.
Bitcoin price failed to climb above key resistances and declined against the US Dollar. BTC is likely to retest the key $3,600 support area before it could bounce back above $3,800.
Bitcoin Price Analysis
This past week, we saw many rejections near the $3,900 and $3,860 resistances in bitcoin price against the US Dollar. The BTC/USD pair topped near the $3,860 level and later started a downward move. It broke the $3,800 and $3,760 support levels to move into a bearish zone. The recent decline was crucial as the price settled below the $3,800 level and the 100 hourly simple moving average. The decline was such that the price even broke the $3,720 support level.
Moreover, there was a break below a declining channel with resistance at $3,800 on the hourly chart of the BTC/USD pair. Finally, a new intraday low was formed near $3,692. In the short term, there could be a minor upside correction towards $3,760 or $3,750. The 50% Fib retracement level of the recent decline from the $3,805 high to $3,692 low is near the $3,748 level to act as a resistance. However, the main resistance is near the $3,800 level and the channel upper trend line.
An intermediate resistance is near the $3,775 level. It coincides with the 76.4% Fib retracement level of the recent decline from the $3,805 high to $3,692 low. Therefore, if the price corrects higher, it could struggle to clear the $3,760, $3,775 and $3,800 resistance levels. The main hurdle for buyers remain near $3,860, above which the price may move into a bullish zone.
Looking at the chart, bitcoin price is slowly declining towards the $3,680 and $3,650 support levels. If sellers remain in action, there are even chances of more losses below the $3,640 level. The key support is at $3,600, where buyers are likely to take a stand. On the other hand, to start a decent uptrend, the price must clear the $3,800 and $3,860 resistance levels.
Technical indicators
Hourly MACD – The MACD is gaining momentum in the bearish zone.
Hourly RSI (Relative Strength Index) – The RSI for BTC/USD declined heavily and it seems to be heading towards the 15 level.
Major Support Level – $3,650 followed by $3,600.
Major Resistance Level – $3,760, $3,775 and 3,800.