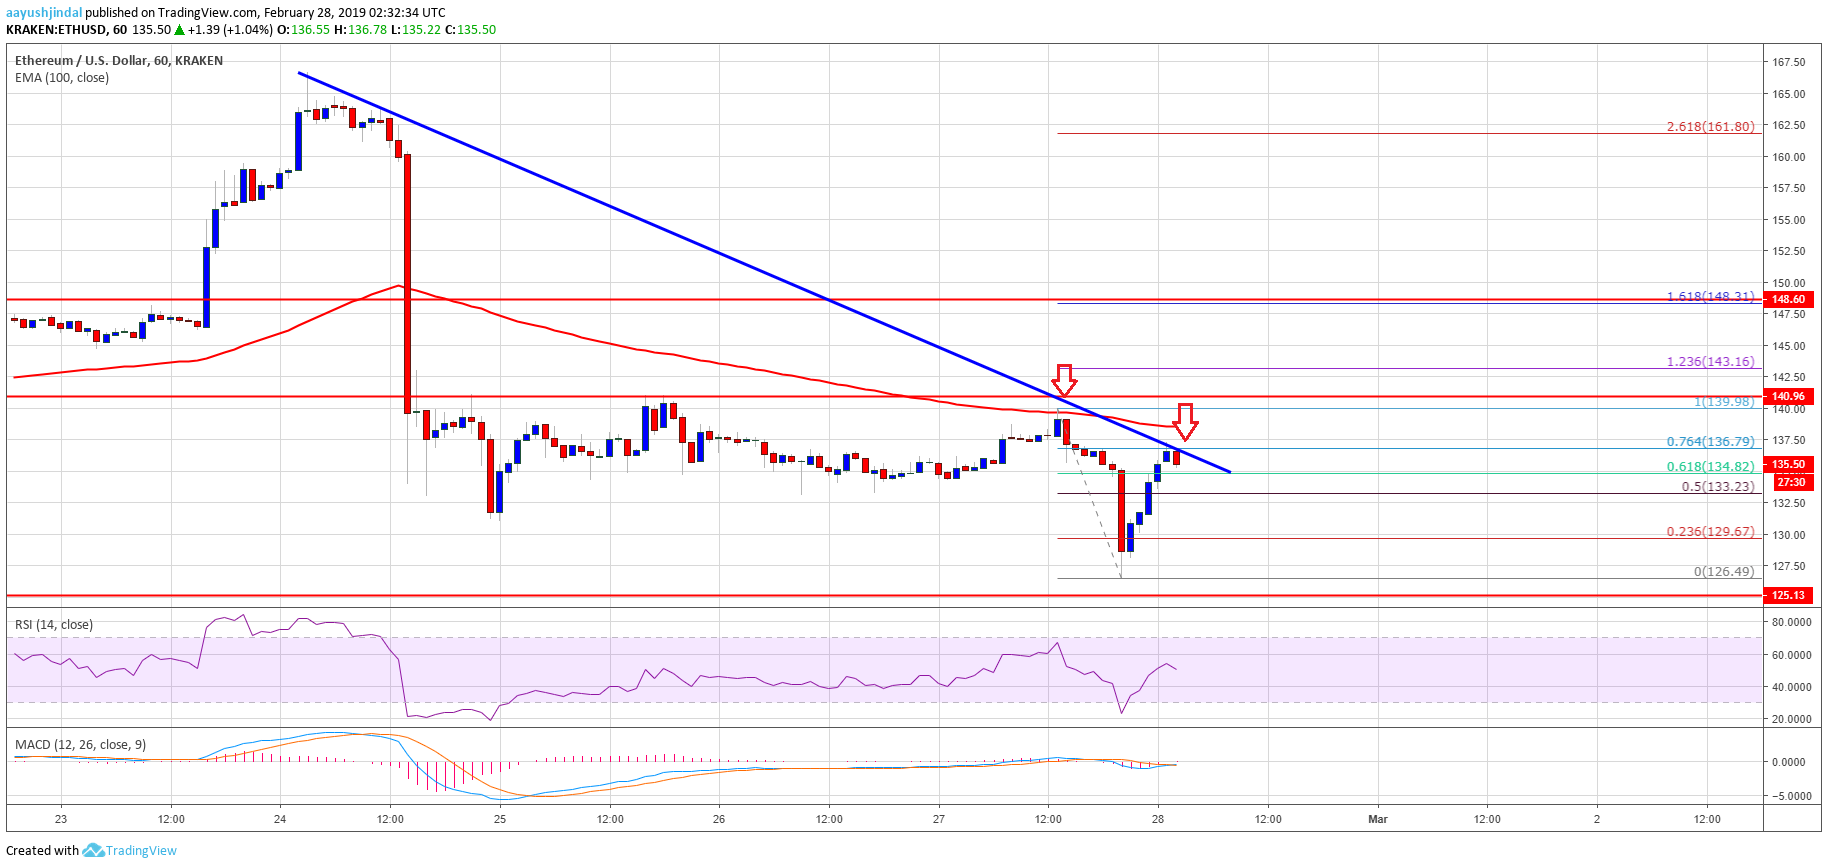
- ETH price traded lower and broke the recent swing low to form near low near $126 against the US Dollar.
- The price bounced back sharply above the $130 resistance after trading to a new weekly low.
- There is a significant bearish trend line in place with resistance at $137 on the hourly chart of ETH/USD (data feed via Kraken).
- The pair is still facing many strong hurdles near the $137, $138 and $141 resistance levels.
Ethereum price declined further and later recovered against the US Dollar and bitcoin. However, ETH/USD is facing a strong resistance near the $137 level, followed by the $141 zone.
Ethereum Price Analysis
Yesterday, we discussed above a fresh weekly low below $130 in ETH price against the US Dollar. The ETH/USD pair did trade lower after it failed to move above the $138 and $140 resistance levels. During the decline, there was a break below the 61.8% Fib retracement level of the last leg from the $131 low to $141 high. The decline was strong as the price broke the $131 and $130 support levels. Sellers gained traction and pushed the price to a new weekly low below $130.
A swing low was formed near $126 and later the price bounced back. It recovered nicely above the $128 and $130 resistance levels. Besides, there was a break above the 50% Fib retracement level of the recent drop from the $139 high to $126 low. However, the price is facing a strong resistance near the $136-137 zone. More importantly, there is a significant bearish trend line in place with resistance at $137 on the hourly chart of ETH/USD. The trend line coincides with the 76.4% Fib retracement level of the recent drop from the $139 high to $126 low.
Finally, the 100 hourly simple moving average is positioned near the $139 level to act as a strong resistance. Therefore, it seems like there are many resistances formed near $137, $138 and $140 levels. ETH must break the $140 and $141 resistance levels to move into a bullish zone. If it fails to gain pace above $137 and $138, there is a risk of a fresh decline in the near term.

Looking at the chart, ETH price bounced back nicely from the $126 swing low. However, it is facing an uphill task near the $137, $138 and $140 levels. A continuous failure to break to the upside may result in more losses below $130.
ETH Technical Indicators
Hourly MACD – The MACD for ETH/USD is about to move back in the bullish zone.
Hourly RSI – The RSI for ETH/USD recovered nicely and it managed to move back above the 50 level.
Major Support Level – $130
Major Resistance Level – $141


