- Bitcoin price declined sharply below the $3,750 support and tested $3,650 against the US Dollar.
- The price bounced back from the $3,653 low and broke the key $3,750 resistance.
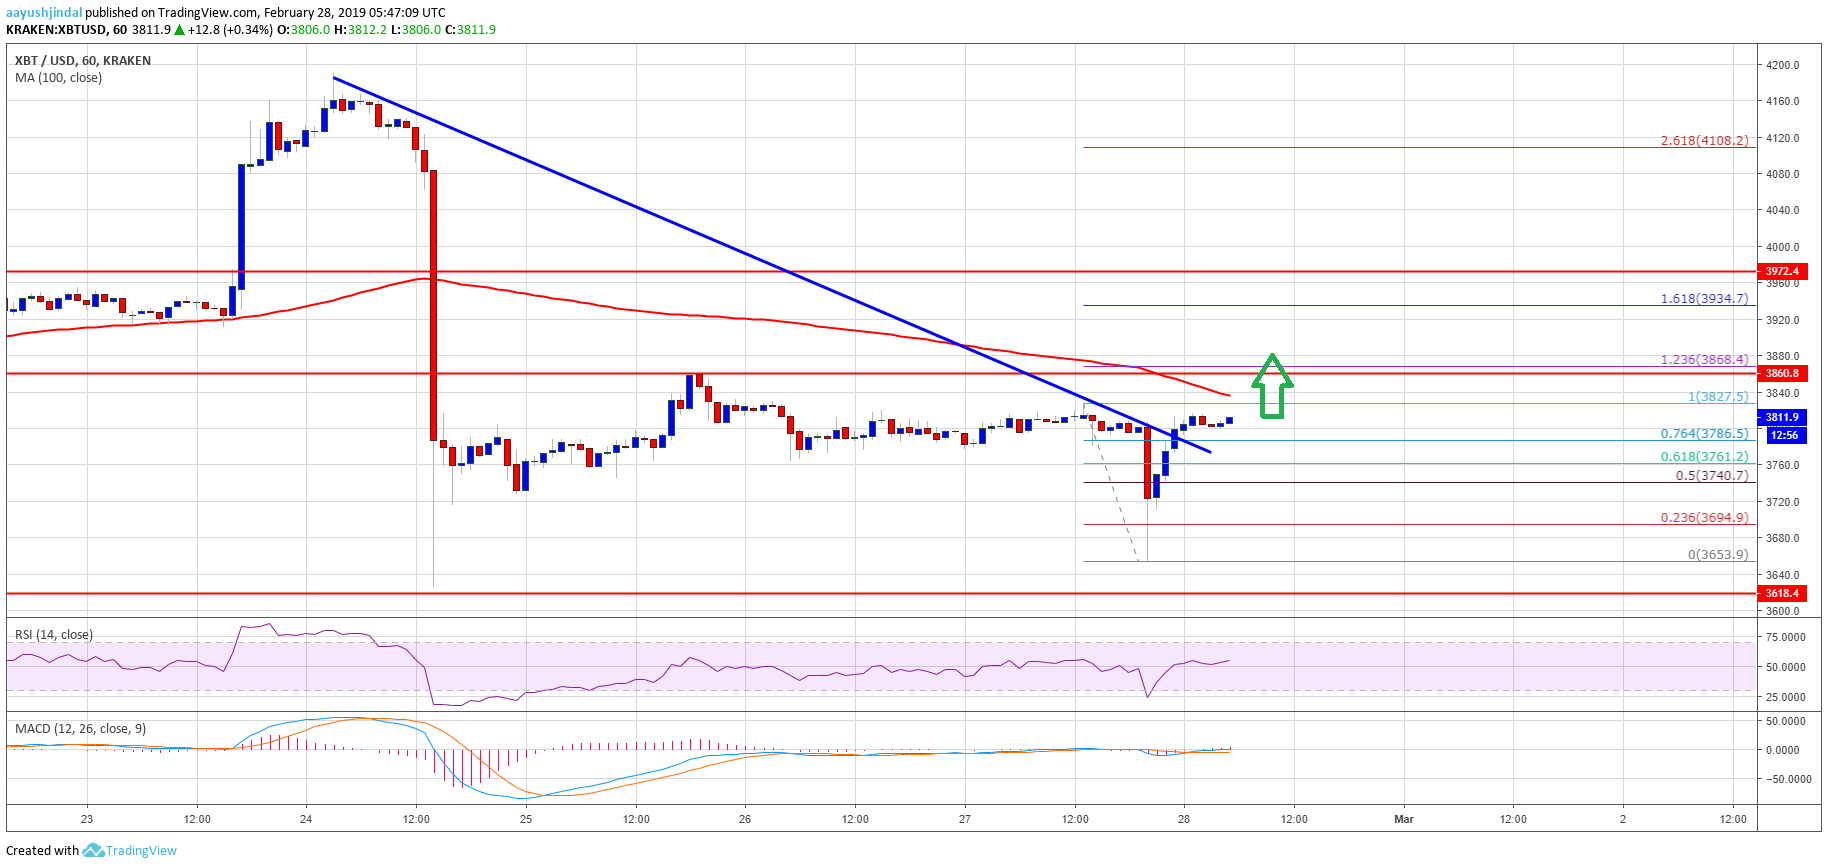
- There was a break above a major bearish trend line with resistance at $3,785 on the hourly chart of the BTC/USD pair (data feed from Kraken).
- The pair is likely to gain bullish momentum above the $3,860 and $3,900 resistance levels.
Bitcoin price tumbled below $3,700 and later recovered sharply against the US Dollar. BTC is pointing bullish signals and it could continue to rise towards $4,000 in the near term.
Bitcoin Price Analysis
Yesterday, we discussed the chances of more losses if bitcoin price breaks the $3,750 support against the US Dollar. The BTC/USD pair did break the $3,750 support and declined below the $3,700 level. There was a sharp downward move and the price tested the $3,650 support. A new weekly low was formed at $3,653 and later the price bounced back. The recent recovery was strong as the price climbed above the $3,750 and $3,760 resistance levels.
There was a break above the 61.8% Fib retracement level of the recent decline from the $3,827 high to $3,653 low. More importantly, there was a break above a major bearish trend line with resistance at $3,785 on the hourly chart of the BTC/USD pair. It has opened the doors for more gains above the $3,800 level. BTC is currently trading above the 76.4% Fib retracement level of the recent decline from the $3,827 high to $3,653 low. Therefore, there are chances of more gains above the last swing high at $3,827. An immediate resistance is at $3,830 and the 100 hourly simple moving average.
If there is a break above the 100 hourly SMA, the price could climb towards the $3,860 resistance. A successful close above $3,860 and $3,900 will most likely set the tone for a rally towards the $4,000 resistance. In the mentioned case, the price may even climb above $4,050. On the other hand, an initial support is at $3,760, below which the price could test $3,700.

Looking at the chart, bitcoin price is slowly moving into the positive zone above $3,800. However, it must gain momentum above the $3,860 and $3,900 resistances to climb further higher. In the short term, there could be range moves before the price makes the next move either above $3,900 or dive back to $3,700.
Technical indicators
Hourly MACD – The MACD is slowly gaining momentum in the bullish zone.
Hourly RSI (Relative Strength Index) – The RSI for BTC/USD climbed back above the 50 level.
Major Support Level – $3,750 followed by $3,720.
Major Resistance Level – $3,830, $3,860 and 3,900.


