
Reason to trust
How Our News is Made
Strict editorial policy that focuses on accuracy, relevance, and impartiality
Ad discliamer
Morbi pretium leo et nisl aliquam mollis. Quisque arcu lorem, ultricies quis pellentesque nec, ullamcorper eu odio.
- ETH price failed to move above the $140 and $142 resistance levels against the US Dollar.
- The price broke the $136 support and it seems like it could continue to move down in the near term.
- Yesterday’s highlighted key breakout pattern was breached with support at $136 on the hourly chart of ETH/USD (data feed via Kraken).
- The pair remains in a bearish zone and it could trade below the $131 and $130 levels.
Ethereum price failed to recover above key levels against the US Dollar and bitcoin. ETH/USD is under pressure and it may continue to move down towards $130 and $126 in the coming sessions.
Ethereum Price Analysis
After trading as low as $131, ETH price started an upside correction against the US Dollar. The ETH/USD pair traded above the $135 and $136 resistance levels. However, the upside move was capped by the $140 and $142 resistance levels. Moreover, there was no proper close above the 23.6% Fib retracement level of the last drop from the $166 high to $131 low. The price clearly failed near the $141-142 resistance zone, resulting in a fresh decline.
Finally, the price broke the $137 and $136 support levels to start a fresh bearish moves. It traded below the $136 support and settled below the 100 hourly simple moving average. Besides, there was a break below the 61.8% Fib retracement level of the recent wave from the $131 low to $141 high. More importantly, yesterday’s highlighted key breakout pattern was breached with support at $136 on the hourly chart of ETH/USD. These all are bearish signs below $136 and suggests more losses in the near term.
An immediate support is at $133 and the 76.4% Fib retracement level of the recent wave from the $131 low to $141 high. If sellers push the price below the $133 level, ETH could revisit the $131 swing low. On the upside, the main resistance levels are near $138, $140 and $142. A successful close above $141-142 followed by a break above the 100 hourly SMA is needed for more gains.
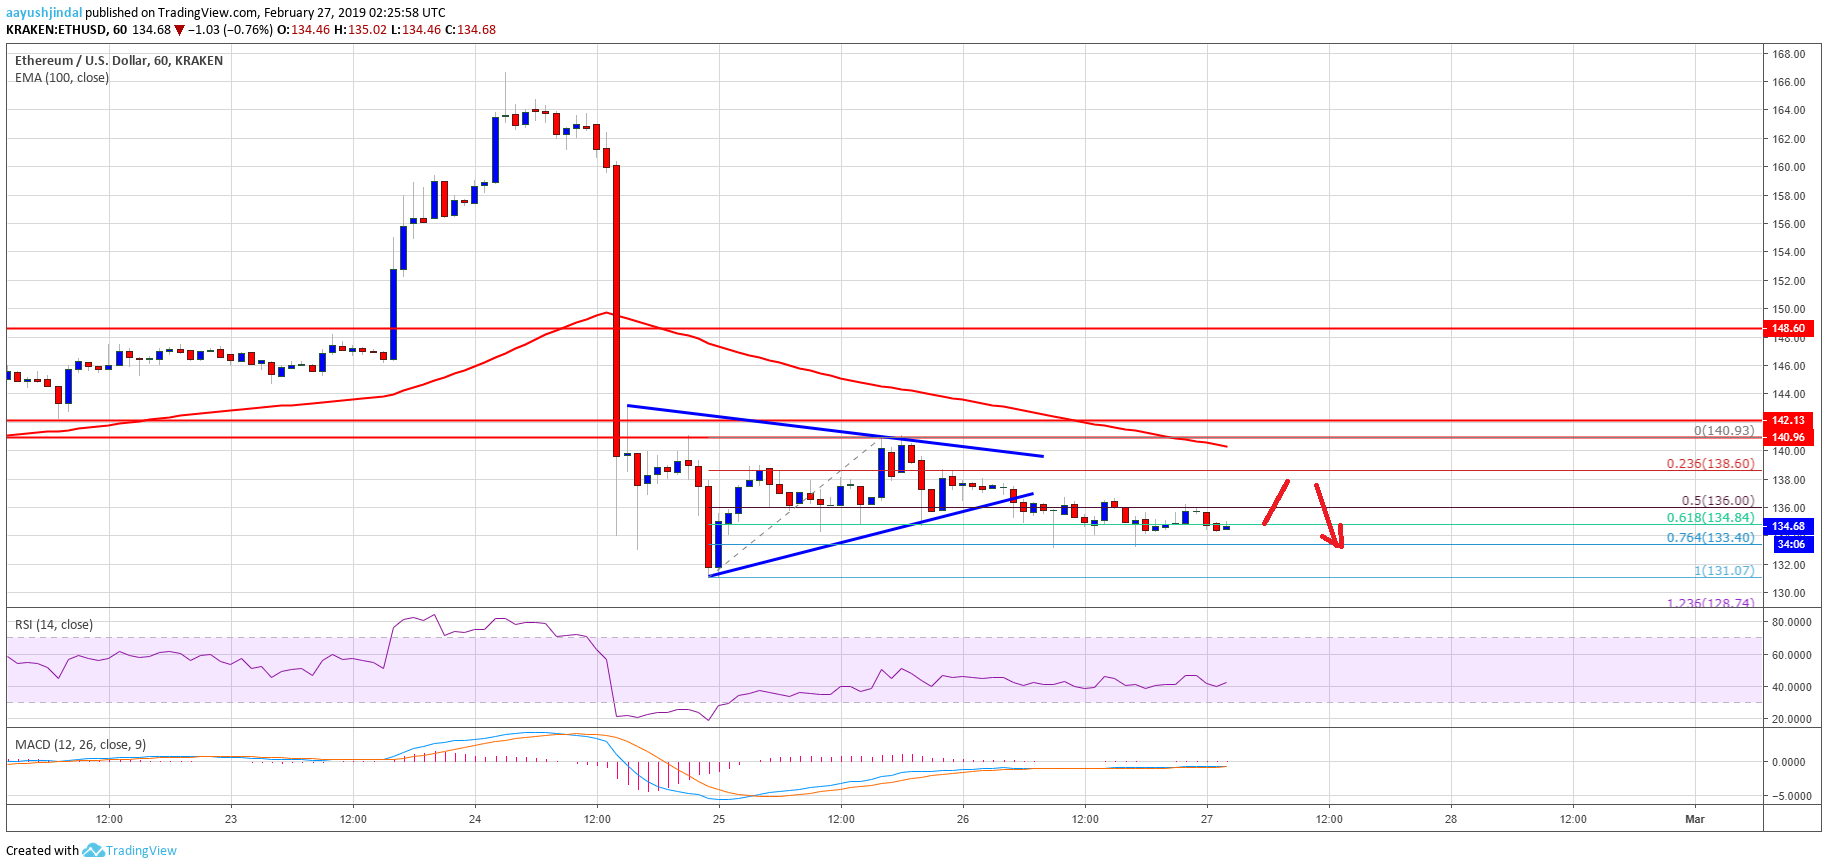
Looking at the chart, ETH price is placed in a bearish zone and it could trade below the $131 and $130 levels. There are even chances of more losses below the $131 swing low. The next key support is at near the $128 level followed by the $126 level. Below $126, the price could revisit the $120 zone.
ETH Technical Indicators
Hourly MACD – The MACD for ETH/USD is suggesting bearish structure, with a possible flat structure.
Hourly RSI – The RSI for ETH/USD is currently just above the 40 level, with a minor bullish angle.
Major Support Level – $132
Major Resistance Level – $142


