
Reason to trust
How Our News is Made
Strict editorial policy that focuses on accuracy, relevance, and impartiality
Ad discliamer
Morbi pretium leo et nisl aliquam mollis. Quisque arcu lorem, ultricies quis pellentesque nec, ullamcorper eu odio.
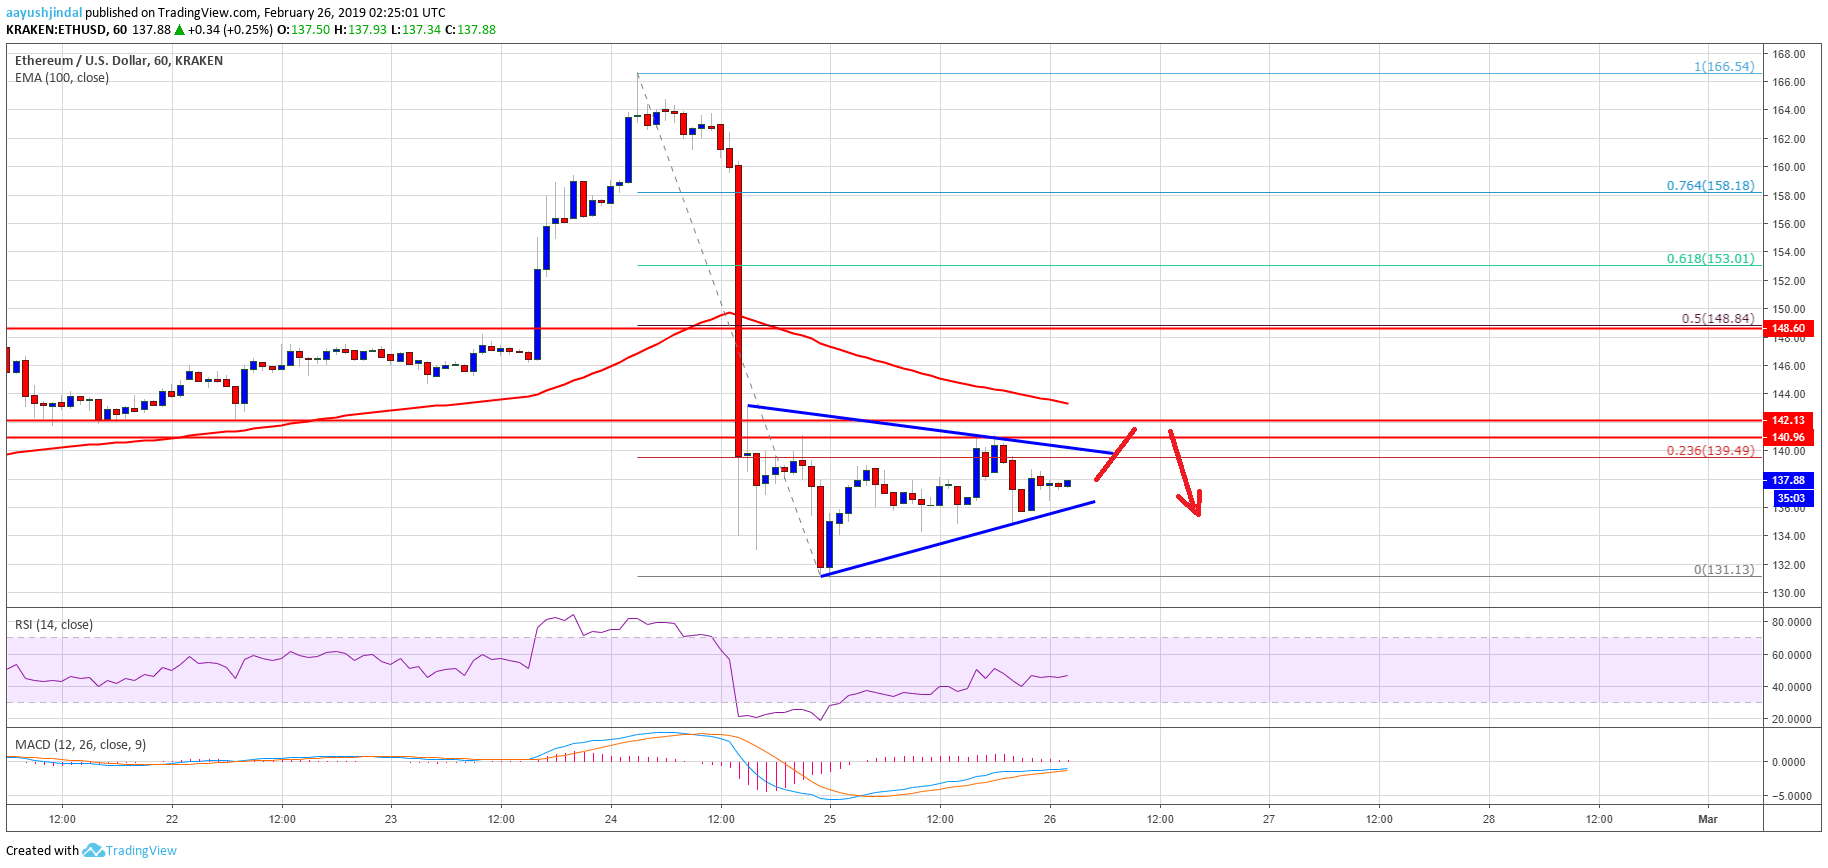
- ETH price corrected a few points after a sharp decline below the $142 support area against the US Dollar.
- The price corrected above $138, but the previous supports at $141 and $142 prevented gains.
- There is a short term breakout pattern in place with resistance at $140 on the hourly chart of ETH/USD (data feed via Kraken).
- The pair must break the $142 resistance and the 100 hourly simple moving average to move into a positive zone.
Ethereum price started consolidating losses after a major drop against the US Dollar and bitcoin. ETH/USD remains sell on rallies until it breaks the $142 barrier and the 100 hourly SMA.
Ethereum Price Analysis
Recently, we saw a sharp decline in ETH price from well above $165 against the US Dollar. The ETH/USD pair broke many supports such as $155, $150 and $142. It even broke the $136 support and traded near the $130-131 zone. A low was formed near $131 and later the price started correcting higher. It moved above the $135 and $136 levels and later started consolidating losses. Buyers pushed the price towards the 23.6% Fib retracement level of the recent drop from the $166 high to $131 low.
However, the $141 and $142 levels acted as a strong resistance. At the outset, it seems like there is a short term breakout pattern in place with resistance at $140 on the hourly chart of ETH/USD. On the upside, the pair needs to clear the triangle resistance and the $142 level. The main resistance is near the $144 level and the 100 hourly simple moving average. If buyers succeed in clearing the 100 hourly SMA and $144, there could be more gains. The next key resistance is near the $149 level. It represents the 50% Fib retracement level of the recent drop from the $166 high to $131 low.
On the other hand, if there is no upside break above $144, the price could decline further. A break below the $136 support may push the price towards the $132 level. Finally, a break below the recent swing low will most likely push the price below $130.
Looking at the chart, ETH price might continue to struggle near the $141, $142 and $144 resistance levels. However, if there is a successful close above $144 and the 100 hourly SMA, buyers could gain momentum in the near term.
ETH Technical Indicators
Hourly MACD – The MACD for ETH/USD is slightly placed in the bullish zone, with no major bullish signal.
Hourly RSI – The RSI for ETH/USD is currently just around the 50 level, with a flat structure and neutral bias.
Major Support Level – $132
Major Resistance Level – $142