
Reason to trust
How Our News is Made
Strict editorial policy that focuses on accuracy, relevance, and impartiality
Ad discliamer
Morbi pretium leo et nisl aliquam mollis. Quisque arcu lorem, ultricies quis pellentesque nec, ullamcorper eu odio.
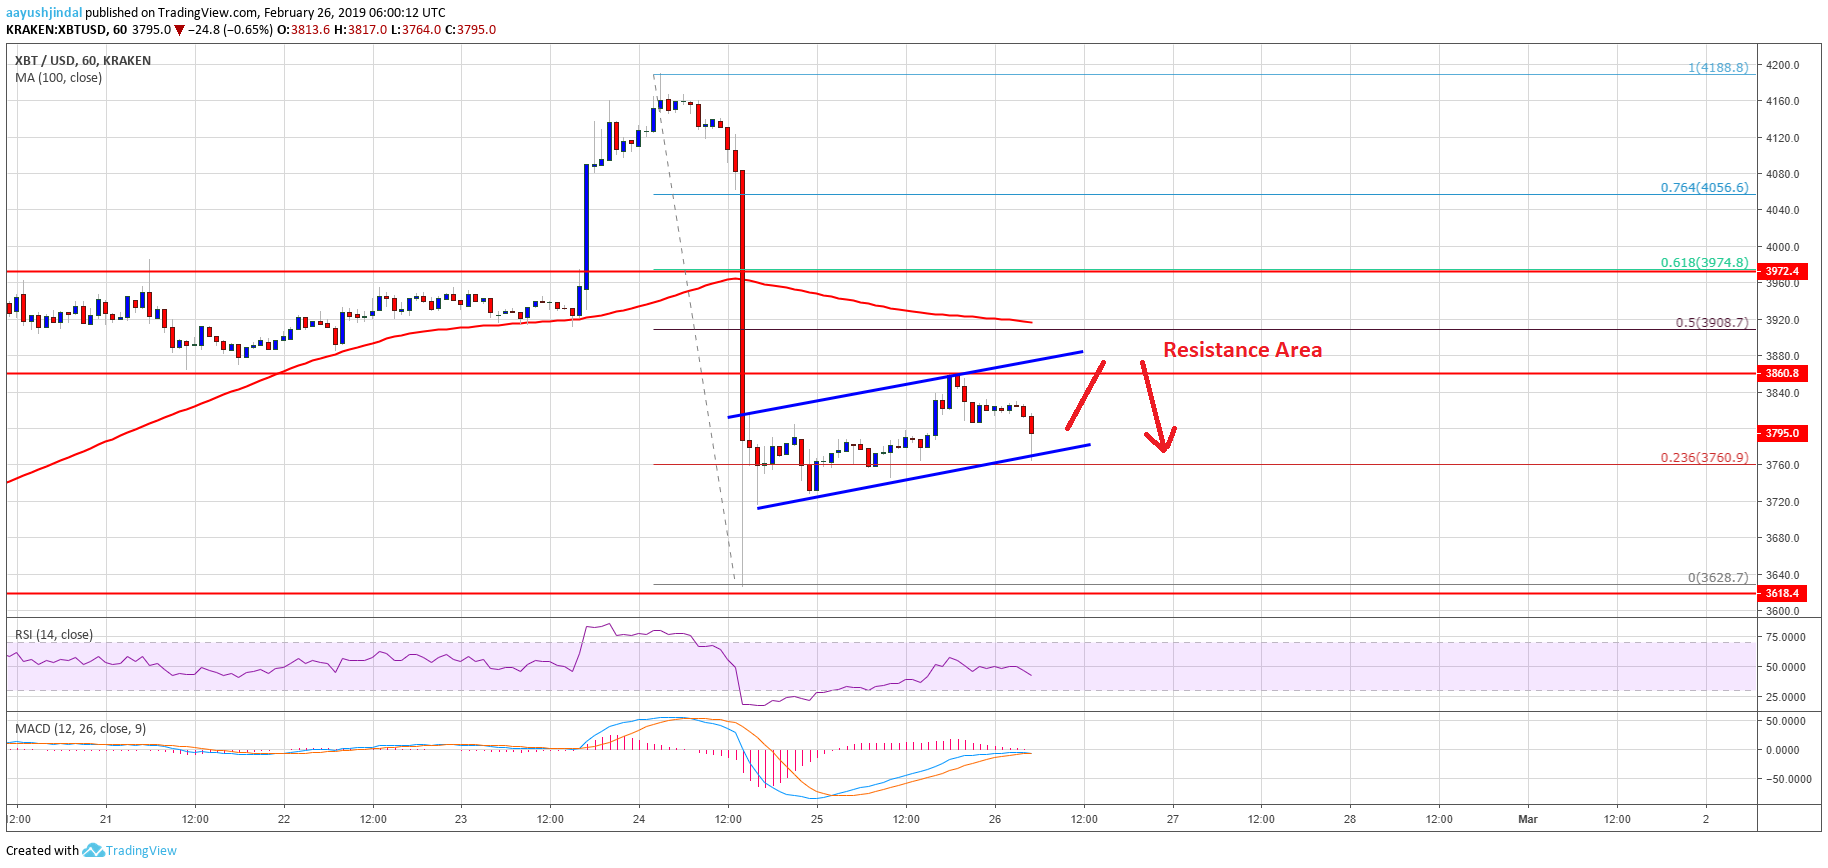
- Bitcoin price declined heavily and later found support near the $3,630 level against the US Dollar.
- The price recovered recently and traded above the $3,700 and $3,750 resistance levels.
- There is a short term ascending channel in place with resistance at $3,880 on the hourly chart of the BTC/USD pair (data feed from Kraken).
- The pair is likely to face a strong resistance near the $3,880 and $3,900 levels in the near term.
Bitcoin price started a decent recovery above $3,750 against the US Dollar. However, BTC is likely to struggle near the $3,900 resistance and it could later extend slides.
Bitcoin Price Analysis
Yesterday, we saw a nasty decline from the $4,188 swing high in bitcoin price against the US Dollar. The BTC/USD pair traded sharply lower and broke the $4,000 and $3,800 support levels. It traded close to the $3,600 level and found support near $3,630. A base was formed and later the price recovered above the $3,700 resistance. There was a break above the 23.6% Fib retracement level of the recent decline from the $4,188 high to $3,628 low.
Buyers even managed to push the price above the $3,750 and $3,800 levels. However, the previous support at $3,860 acted as a strong resistance. At the outset, there is a short term ascending channel in place with resistance at $3,880 on the hourly chart of the BTC/USD pair. The pair recently tested the channel support at $3,775 and bounced back. However, there are many hurdles on the upside, starting with $3,860. The main resistance zone is near the $3,880 and $3,900 levels.
Besides, the 50% Fib retracement level of the recent decline from the $4,188 high to $3,628 low is at $3,908 to act as a resistance. Finally, the 100 hourly simple moving average is positioned near the $3,920 level. Therefore, it seems like there is a strong resistance formed near $3,900 and the 100 hourly SMA. Only a successful close above the $3,920 level could start a fresh upward move in the near term. If not, the price could resume its slide below the $3,750 support.
Looking at the chart, bitcoin price recovered nicely from the $3,630 support. Having said that, sellers are still in control as long as the price is below $3,900 and $3,920. If there is a fresh decline, the price could revisit the $3,630 and $3,600 support levels.
Technical indicators
Hourly MACD – The MACD is about to move back in the bearish zone.
Hourly RSI (Relative Strength Index) – The RSI for BTC/USD failed to stay above the 50 level and it is currently moving lower.
Major Support Level – $3,750 followed by $3,650.
Major Resistance Level – $3,860, $3,880 and 3,900.