
Reason to trust
How Our News is Made
Strict editorial policy that focuses on accuracy, relevance, and impartiality
Ad discliamer
Morbi pretium leo et nisl aliquam mollis. Quisque arcu lorem, ultricies quis pellentesque nec, ullamcorper eu odio.
- Bitcoin price extended gains and broke the $3,950 and $4,000 resistance levels against the US Dollar.
- The price traded to a new 2019 high above $4,100 and it could continue to rise in the near term.
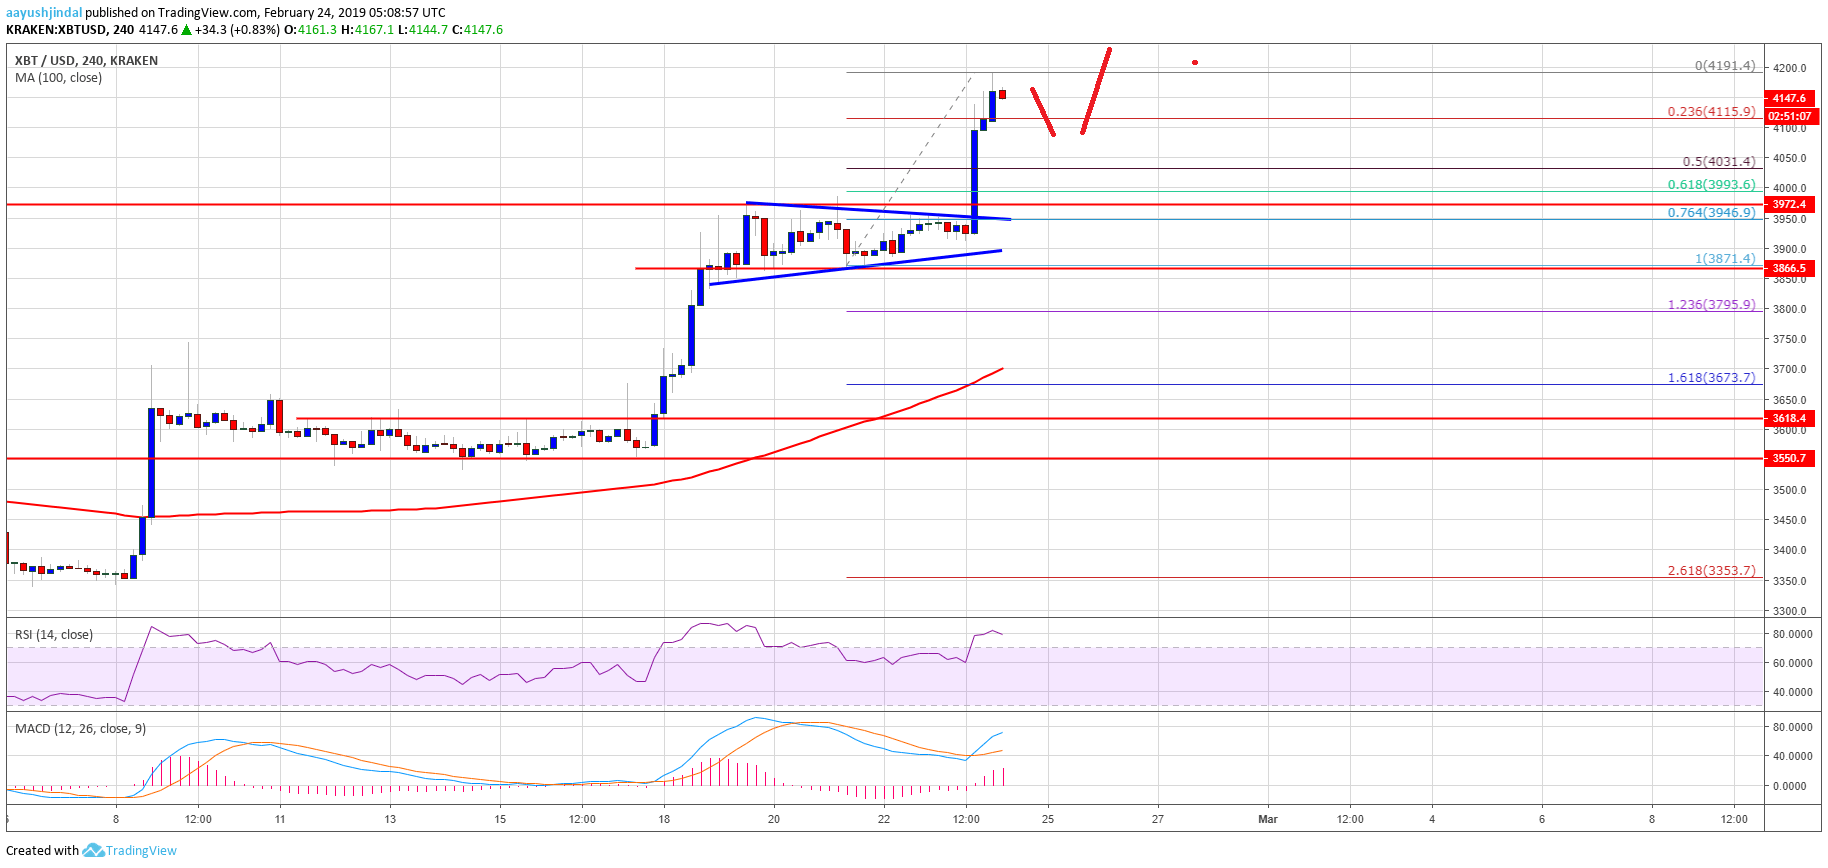
- There was a break above a major triangle pattern with resistance near $3,950 on the 4-hours chart of the BTC/USD pair (data feed from Kraken).
- The pair traded above the $4,150 resistance and it could accelerate towards $4,250 and $4,400.
Bitcoin price climbed higher sharply above the $4,000 barrier against the US Dollar. BTC/USD could correct a few points, but dips remain supported above $4,000 in the short term.
Bitcoin Price Analysis
This past week, we saw a lot of bullish moves above the $3,600 support in bitcoin price against the US Dollar. The BTC/USD pair rallied above the $3,800 and $3,900 resistance levels. However, sellers fought hard near the $3,950 and $4,000 resistance levels. As a result, there were a couple of bearish moves, but the $3,800 support area acted as a solid buy zone. Finally, buyers had the upper hand and pushed the price above the $3,950 and $4,000 resistance levels.
More importantly, there was a break above a major triangle pattern with resistance near $3,950 on the 4-hours chart of the BTC/USD pair. The pair settled above the $4,000 level and the 100 simple moving average (4-hours). The upward move was such that the price traded to a new 2019 high above $4,100. It traded towards the $4,200 level and a high was formed at $4,191. The price is currently correcting lower, but it remains well supported above $4,100 and $4,050. An initial support is the 23.6% Fib retracement level of the last wave from the $3,871 low to $4,191 high.
On the downside, there are many supports near the $4,050 level. Below $4,050, the next support is near the $4,030 level. It represents the 50% Fib retracement level of the last wave from the $3,871 low to $4,191 high. The main support is near the $4,000 level (the previous resistance). Therefore, if there is a downside correction, the price may perhaps find buyers near $4,050 and $4,000.
Looking at the chart, BTC price is placed nicely in a strong uptrend above the $4,000 resistance area. In the short term, there could be a pullback, but buyers are likely to protect $4,000. On the upside, a break above the $4,200 level could open the doors for $4,250 and $4,400.
Technical indicators
4 hours MACD – The MACD for BTC/USD is gaining pace in the bullish zone.
4 hours RSI (Relative Strength Index) – The RSI for BTC/USD is currently well above the 70 level.
Major Support Level – $4,000
Major Resistance Level – $4,200


