
Reason to trust
How Our News is Made
Strict editorial policy that focuses on accuracy, relevance, and impartiality
Ad discliamer
Morbi pretium leo et nisl aliquam mollis. Quisque arcu lorem, ultricies quis pellentesque nec, ullamcorper eu odio.
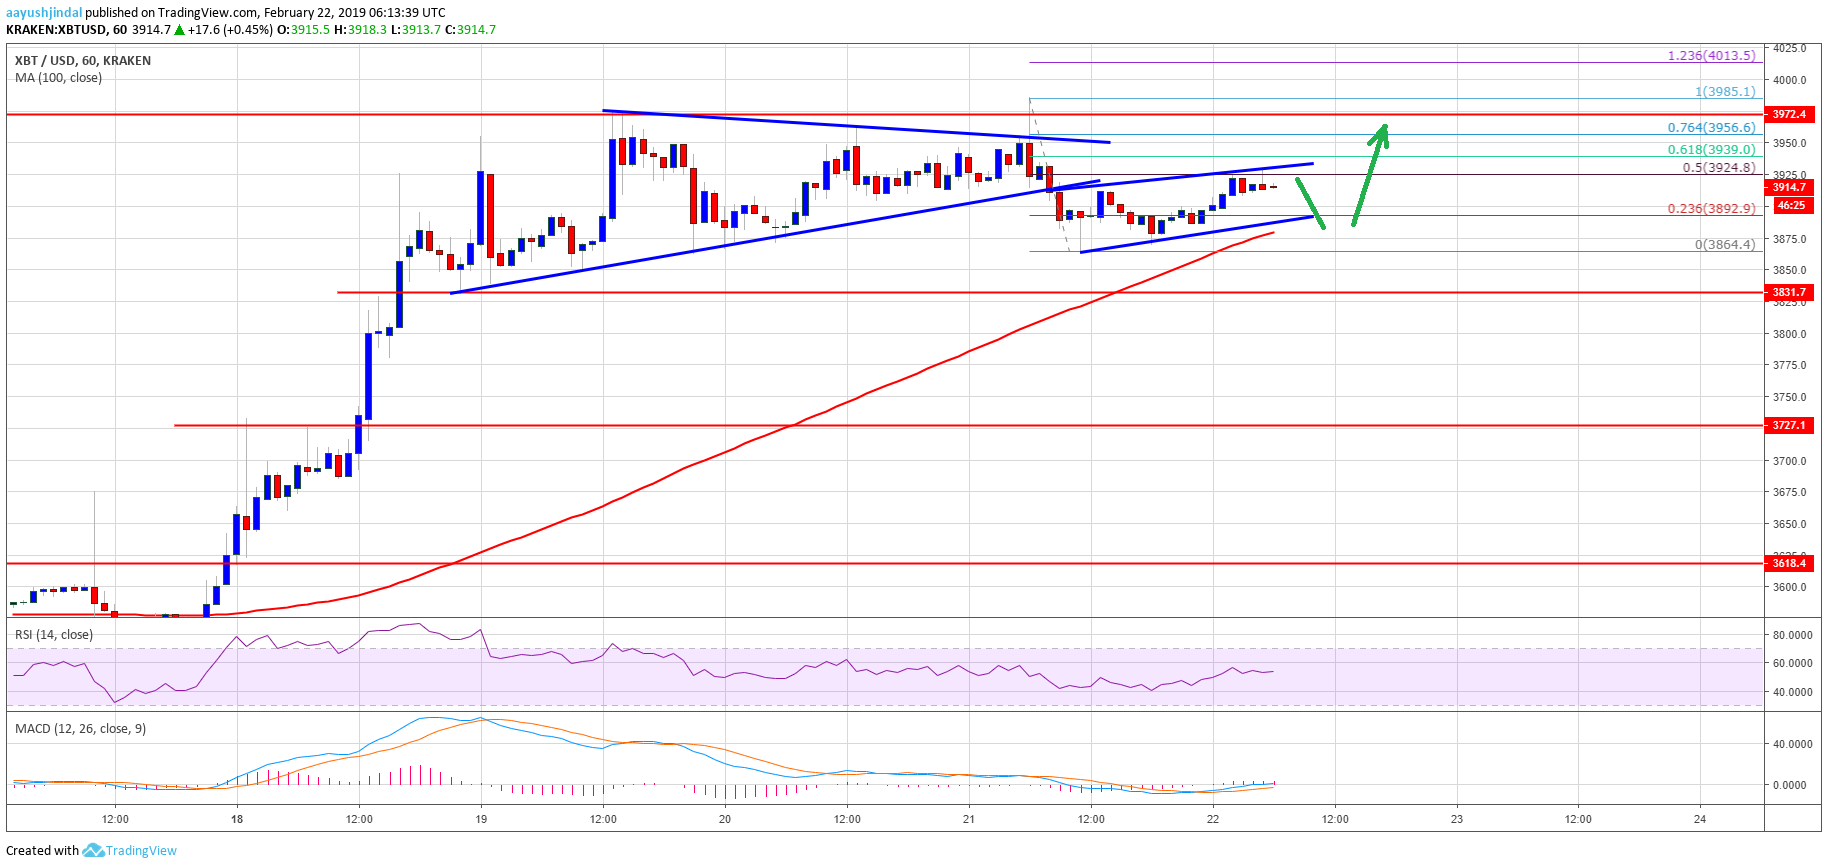
- Bitcoin price spiked towards the $4,000 resistance, but failed once again versus the US Dollar.
- The price traded lower and broke the $3,950 and $3,940 support levels.
- There was a break below a connecting bullish trend line with support at $3,925 on the hourly chart of the BTC/USD pair (data feed from Kraken).
- The pair remains well supported above $3,860 and the 100 hourly simple moving average.
Bitcoin price is still facing a strong resistance near the $4,000 zone against the US Dollar. BTC bears and bulls locked horns as the price prepares for the next key break.
Bitcoin Price Analysis
Yesterday, we discussed about a possible upside acceleration above $4,000 in bitcoin price against the US Dollar. The BTC/USD pair did gain traction and broke the last swing high near $3,972. It traded close to the $4,000 resistance, but failed to gain strength. A new weekly high was formed at $3,985 and later the price declined sharply. The decline was such that the price broke the $3,950 and $3,940 support levels.
More importantly, there was a break below a connecting bullish trend line with support at $3,925 on the hourly chart of the BTC/USD pair. The pair traded close to the $3,860 support, where buyers emerged. A low was formed at $3,864 and the price is currently correcting higher. It moved above $3,900 and the 23.6% Fib retracement level of the recent decline from the $3,985 high to $3,864 low. However, the price is facing resistance near the previous support at $3,925.
Besides, the 50% Fib retracement level of the recent decline from the $3,985 high to $3,864 low is acting as a resistance. It seems like there is an ascending channel in place with resistance at $3,930. A successful break above the channel and $3,940 could push the price towards the $3,970 level. On the downside, an initial support is near the $3,870 level and the 100 hourly simple moving average. The main support is at $3,860, below which the price could test the $3,830 level in the short term.
Looking at the chart, bitcoin price seems to be confined in a tight range below the $4,000 resistance. It could either climb above the $4,000 barrier and trade towards the $4,200 level or extend the recent decline. Having said that, the price must stay above the $3,830 level. If not, there is a risk of a sharp drop towards the $3,720 support.
Technical indicators
Hourly MACD – The MACD is placed slightly in the bullish zone.
Hourly RSI (Relative Strength Index) – The RSI for BTC/USD is placed just above the 50 level.
Major Support Level – $3,860 followed by $3,830.
Major Resistance Level – $3,940, $3,975 and 4,000.


