Reason to trust
How Our News is Made
Strict editorial policy that focuses on accuracy, relevance, and impartiality
Ad discliamer
Morbi pretium leo et nisl aliquam mollis. Quisque arcu lorem, ultricies quis pellentesque nec, ullamcorper eu odio.
- Ripple price gained traction and broke the $0.3400 resistance area before sellers appeared against the US dollar.
- The price topped near the $0.3460 level and later started a sharp downside correction.
- Yesterday’s highlighted major bullish trend line is intact with support near $0.3190 on the hourly chart of the XRP/USD pair (data source from Kraken).
- The price is likely preparing for a fresh upward move as long as it is above the $0.3100 support area.
Ripple price rallied sharply before trimming most of its gains against the US Dollar and bitcoin. XRP/USD remains supported on the downside above $0.3100 and it could bounce back soon.
Ripple Price Analysis
Yesterday, there was a solid upward move in ripple price above the $0.3200 resistance area against the US Dollar. The XRP/USD pair gained traction and broke the $0.3300 and $0.3320 resistance levels. It even broke the $0.3400 resistance and spiked above the $0.3450 level. The price topped near the $0.3460 level and later started a sharp downside correction. It declined below the $0.3320 support and the 50% Fib retracement level of the last wave from the $0.3036 low to $0.3459 high. Sellers even pushed the price below the $0.3250 support area.
However, the price found support near the $0.3160 level. The 61.8% Fib retracement level of the last wave from the $0.3036 low to $0.3459 high also acted as a support. Moreover, yesterday’s highlighted major bullish trend line is intact with support near $0.3190 on the hourly chart of the XRP/USD pair. Below the trend line, the next support is near the $0.3135 level. It coincides with the 76.4% Fib retracement level of the last wave from the $0.3036 low to $0.3459 high. The main support is near the $0.3100 level and the 100 hourly simple moving average.
Therefore, the price is likely to find a lot of buying interest near the $0.3160, $0.3130 and $0.3100 supports. If there is a downside break below the $0.3100 support, the price might move back in a bearish zone. On the other hand, if the price stays above $0.3100, it could start a fresh upward move above $0.3300.
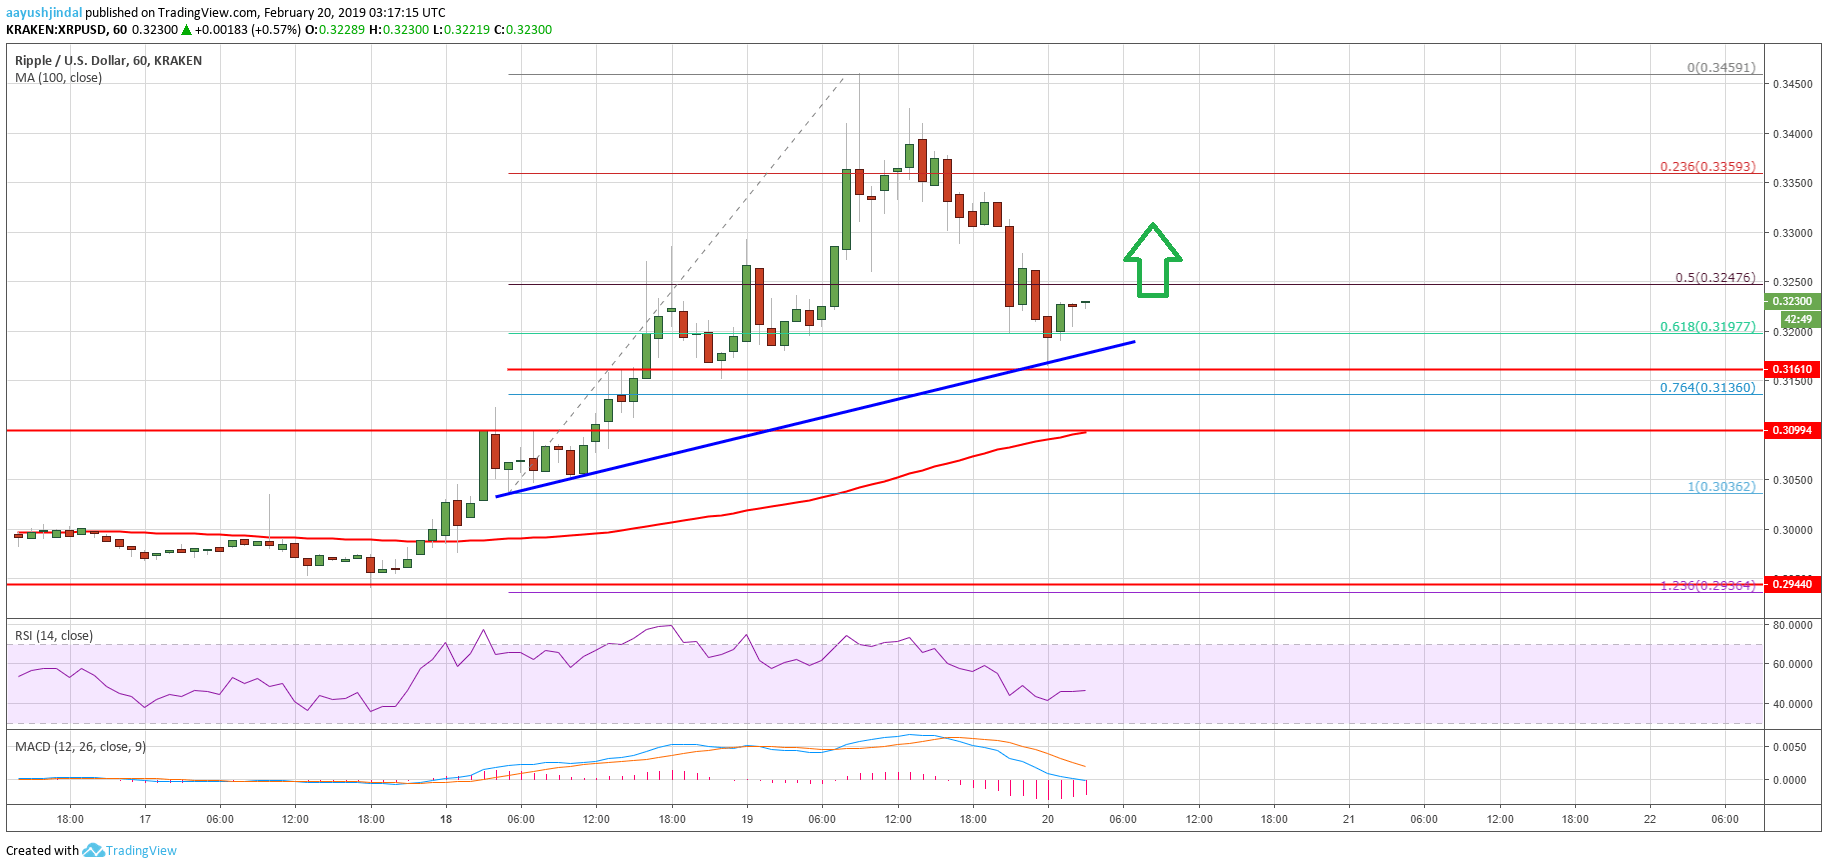
Looking at the chart, ripple price remains well supported above the $0.3100 level. In the short term, there could be range moves, but the price is likely to climb higher once again above $0.3300. The main resistance is near the $0.3350 level, above which there are high chances of gains above $0.3400 in the near term.
Technical Indicators
Hourly MACD – The MACD for XRP/USD is slowly reducing its bearish slope.
Hourly RSI (Relative Strength Index) – The RSI for XRP/USD is moving higher, but it is still below the 50 level.
Major Support Level – $0.3100
Major Resistance Level – $0.3350