Reason to trust
How Our News is Made
Strict editorial policy that focuses on accuracy, relevance, and impartiality
Ad discliamer
Morbi pretium leo et nisl aliquam mollis. Quisque arcu lorem, ultricies quis pellentesque nec, ullamcorper eu odio.
- ETH price extended the recent rally and traded above the $144 and $148 resistances against the US Dollar.
- The price traded close to the $150 level and later started consolidating gains above $145.
- There is a major bullish trend line in place with support at $142 on the hourly chart of ETH/USD (data feed via Kraken).
- There could be a short term downside correction, but buyers remain in action above $140.
Ethereum price posted solid gains against the US Dollar and bitcoin. ETH/USD tested the $150 resistance area and it may now correct lower before a fresh bullish wave in the near term.
Ethereum Price Analysis
Yesterday, we saw a nasty upward move from the $125 swing low in ETH price against the US Dollar. The ETH/USD pair rallied above the $130 and $136 resistance levels to move into a bullish zone. Later, buyers gained traction and pushed the price above the $140 and $142 resistance levels. There was a bearish reaction noted near the $148 level and the price dipped towards the $140 support. Sellers failed to gain momentum, resulting in a fresh upward move above the $145 and $148 resistance levels. It traded close to the $150 resistance and settled well above the 100 hourly simple moving average.
At present, the price is consolidating gains above $145, with a few bearish moves. It broke the 23.6% Fib retracement level of the recent wave from the $134 low to $150 swing high. The last hourly candle is suggesting an increase in selling pressure below $150. However, there are many supports on the downside near the $145, $142 and $140 levels. More importantly, there is a major bullish trend line in place with support at $142 on the hourly chart of ETH/USD.
If there is a break below the trend line, the price could test the $140 support area. It coincides with the 61.8% Fib retracement level of the recent wave from the $134 low to $150 swing high. Any further losses could spark an extended downside correction below $138 and $136. To the topside, the $148 and $150 levels are strong barriers for buyers in the near term.
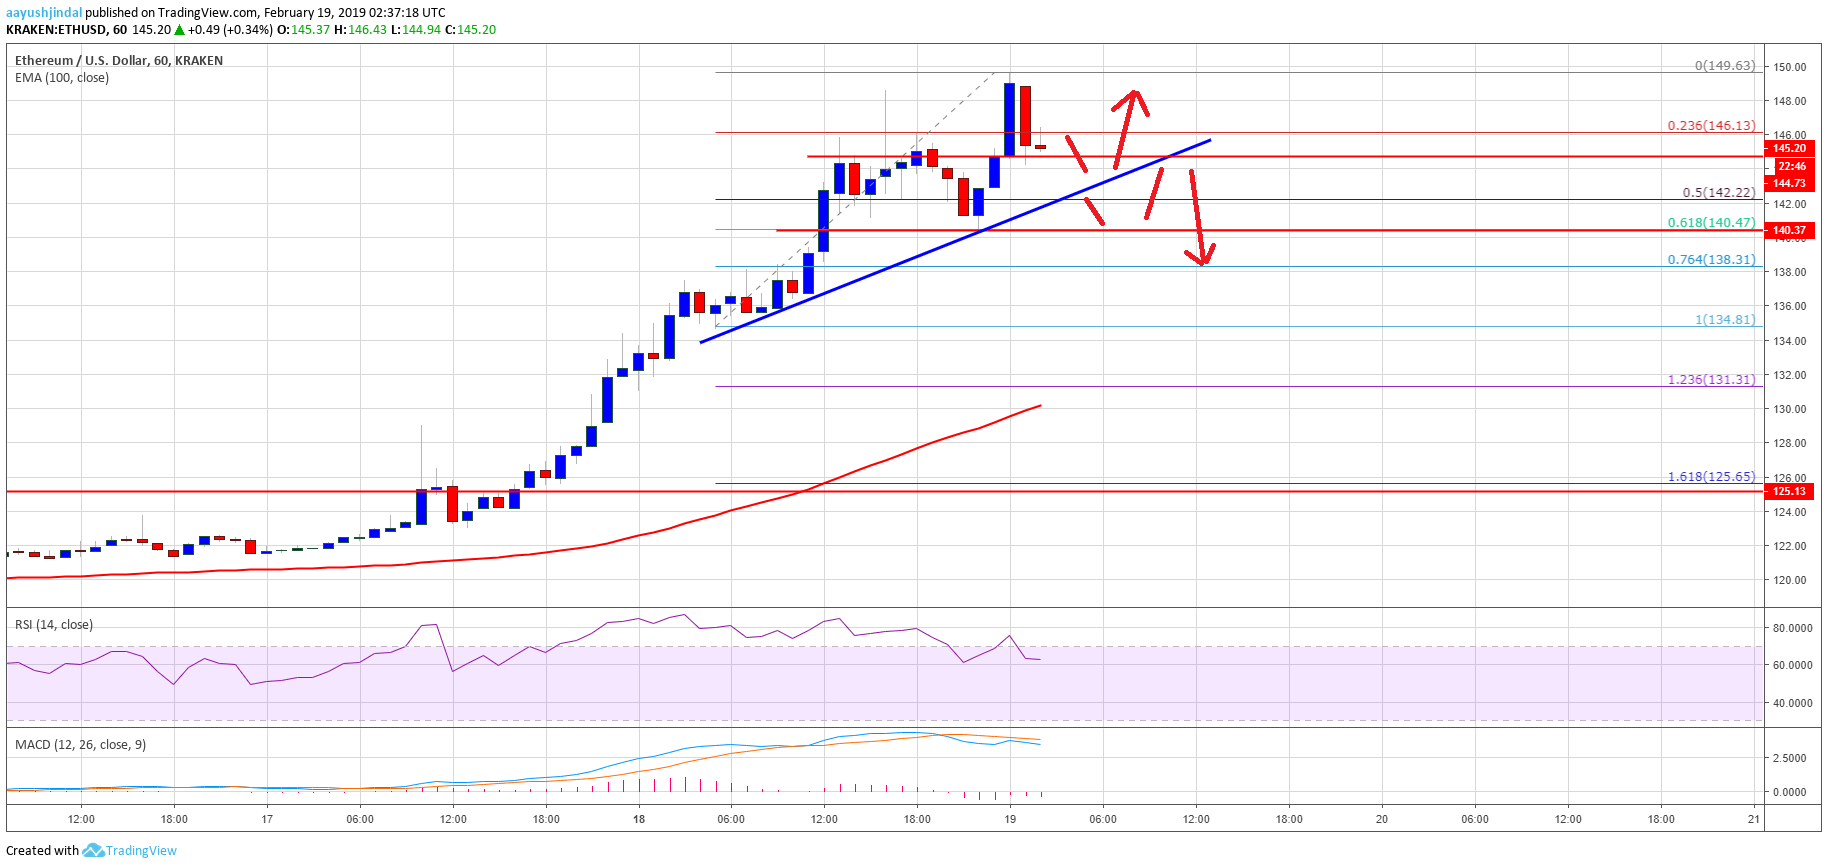
Looking at the chart, ETH price seems to be facing heavy offers near $150. Therefore, there could be a couple of swing moves above $140 before a fresh upward move. Above $150, the next target for might be $154 and $155.
ETH Technical Indicators
Hourly MACD – The MACD for ETH/USD is currently in the bearish zone, but with a few bullish signs.
Hourly RSI – The RSI for ETH/USD is currently correcting lower towards the 60 level.
Major Support Level – $140
Major Resistance Level – $150