Reason to trust

How Our News is Made
Strict editorial policy that focuses on accuracy, relevance, and impartiality
Ad discliamer
Morbi pretium leo et nisl aliquam mollis. Quisque arcu lorem, ultricies quis pellentesque nec, ullamcorper eu odio.
- Bitcoin prices up 8.3 percent in the last week
- Adoption levels could be pumping prices
- Transaction volumes on the rise
Good news is bulls are back. Even with increasing prices, investors and traders have their eyes set on adoption trends. Encouragingly, adoption is on the rise, and now that our previous Bitcoin (BTC) trade plans are live, odds are the next wave of bulls will drive prices towards $6,000.
Bitcoin Price Analysis
Fundamentals
There is an expansion. It seems like the precipitous rise and eventual fall of BTC prices did more good than bad. Yes, prices fell to record lows, and at some point, industry commentators, as well as traders, had strong fundamental reasons to believe that Bitcoin–will despite the fanfare drop, to $3,200 and sub-$2,000 levels.
However, that has not been the case. It’s a recovery, and as prices bottom up, Bitcoin is surely and methodically matching towards its ultimate objective of being a global reserve currency. Skeptics may call this a pipe dream but when we factor in the cyclic nature of prices, the enormous strides made in the last decade and the ballooning fundamentals factors, there is a strong case to argue that Satoshi’s dream wasn’t narrow.
Aside from price action, we note that regulators are thawing to the idea of BTC and the more open up their tax lines partnering with crypto payment processors as BitPay, demand for the coin will keep swelling. Add that to developments like Trading View shifting away from fiat and denominating their premium plans in BTC and Domino’s Pizza accepting BTC via the ever-growing Lightning Network, Bitcoin medium of exchange capability is revealed.
Candlestick Arrangement

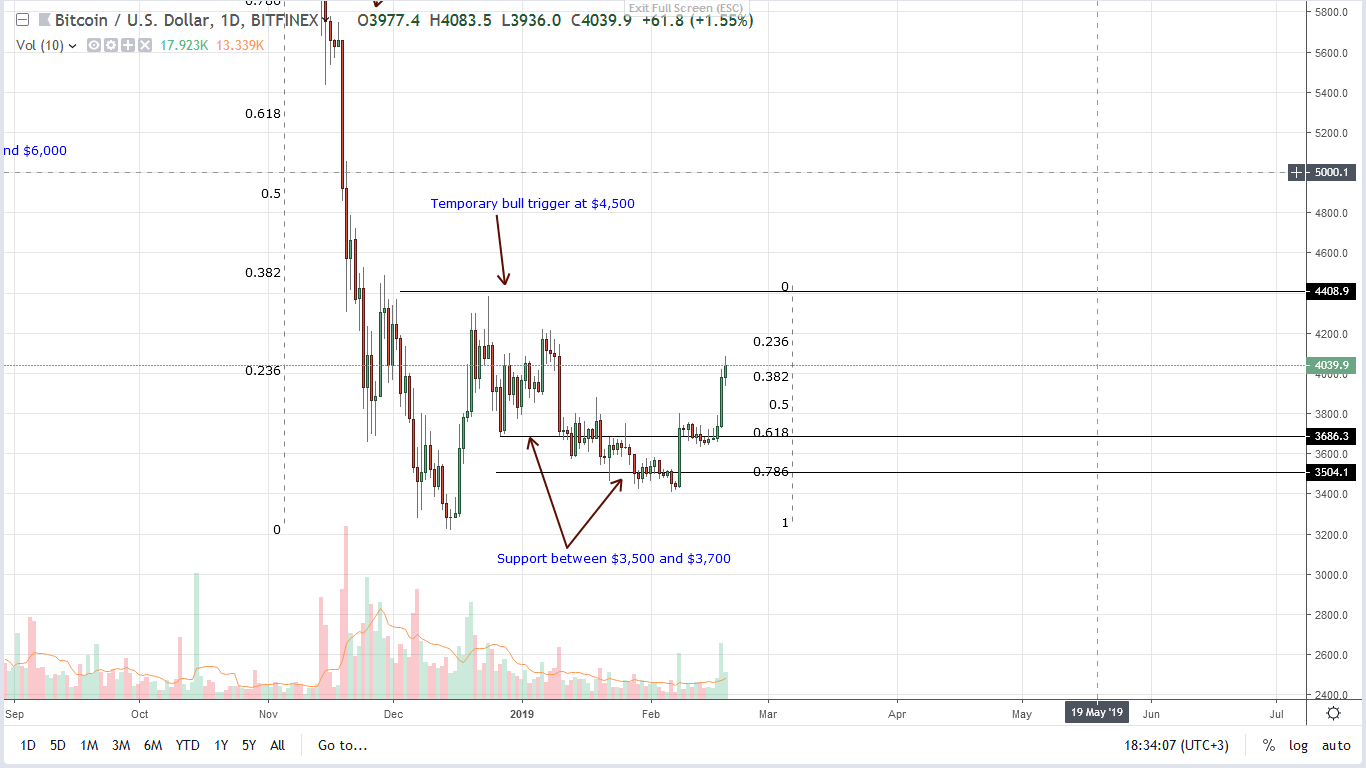
Compared to other coins, BTC is under-performing. At spot rates, the currency is changing hands at $4050–data streams from BitFinex and up 8.3 percent in the last week. It may appear, but Bitcoin (BTC) price swings usually have a magnifier effect on altcoin prices.
Because our trading plans as laid out in previous BTC/USD price analysis are now valid, and prices are trending above $3,800 minor resistance and buy trigger line at the back of decent, above average volumes, risk-off traders can fine-tune entries in lower time frames.
That means every price dip is technically a buying opportunity with the first target at $4,500. On the other hand, risk-averse, conservative type of traders can wait for high-volume expansion above $4,500. From candlestick arrangements and Fibonacci rules, odds are any break above $4,500 could finally thrust prices to $4,500–$6,000 zone.
Technical Indicators
Endorsing our outlook is Feb 18 bull bar. Volumes backing this rally is above average at 37k exceeding those of Feb 8 and that of Jan 10.


