
Reason to trust
How Our News is Made
Strict editorial policy that focuses on accuracy, relevance, and impartiality
Ad discliamer
Morbi pretium leo et nisl aliquam mollis. Quisque arcu lorem, ultricies quis pellentesque nec, ullamcorper eu odio.
- ETH price gained strength above the $125 and $130 resistance levels against the US Dollar.
- There was a proper close above the $130 resistance level and the 100 hourly simple moving average.
- There is a key bullish trend line in place with support at $128 on the hourly chart of ETH/USD (data feed via Kraken).
- The price is likely to continue higher and the next targets for buyers could be $140 and $145.
Ethereum price is gaining strength above key levels against the US Dollar and bitcoin. ETH/USD is placed nicely above $130 and it could accelerate towards $145 in the near term.
Ethereum Price Analysis
In the past few sessions, there was a solid upward move from the $120 swing low in ETH price against the US Dollar. The ETH/USD pair gained strength and broke many important resistances such as $125 and $130. There was a proper close above the $130 resistance level and the 100 hourly simple moving average. Recently, there was a tiny bearish reaction from the $130 resistance, but the $124 level acted as a solid support. The price rallied and broke the $130 and $132 resistances. A new monthly high was formed near $135, with bullish moves.
After testing the $135 resistance, there was a minor downside correction. ETH dipped below the $133 level, but the $132 level acted as a support. Moreover, the 23.6% Fib retracement level of the recent wave from the $123 low to $135 high acted as a support. On the downside, there seems be a lot of supports forming near the $130 and $129 levels. Besides, the 50% Fib retracement level of the recent wave from the $123 low to $135 high is also near the $129 level.
More importantly, there is a key bullish trend line in place with support at $128 on the hourly chart of ETH/USD. Therefore, if the pair corrects lower in the short term, there could be a strong buying interest near the $129 and $130 levels.
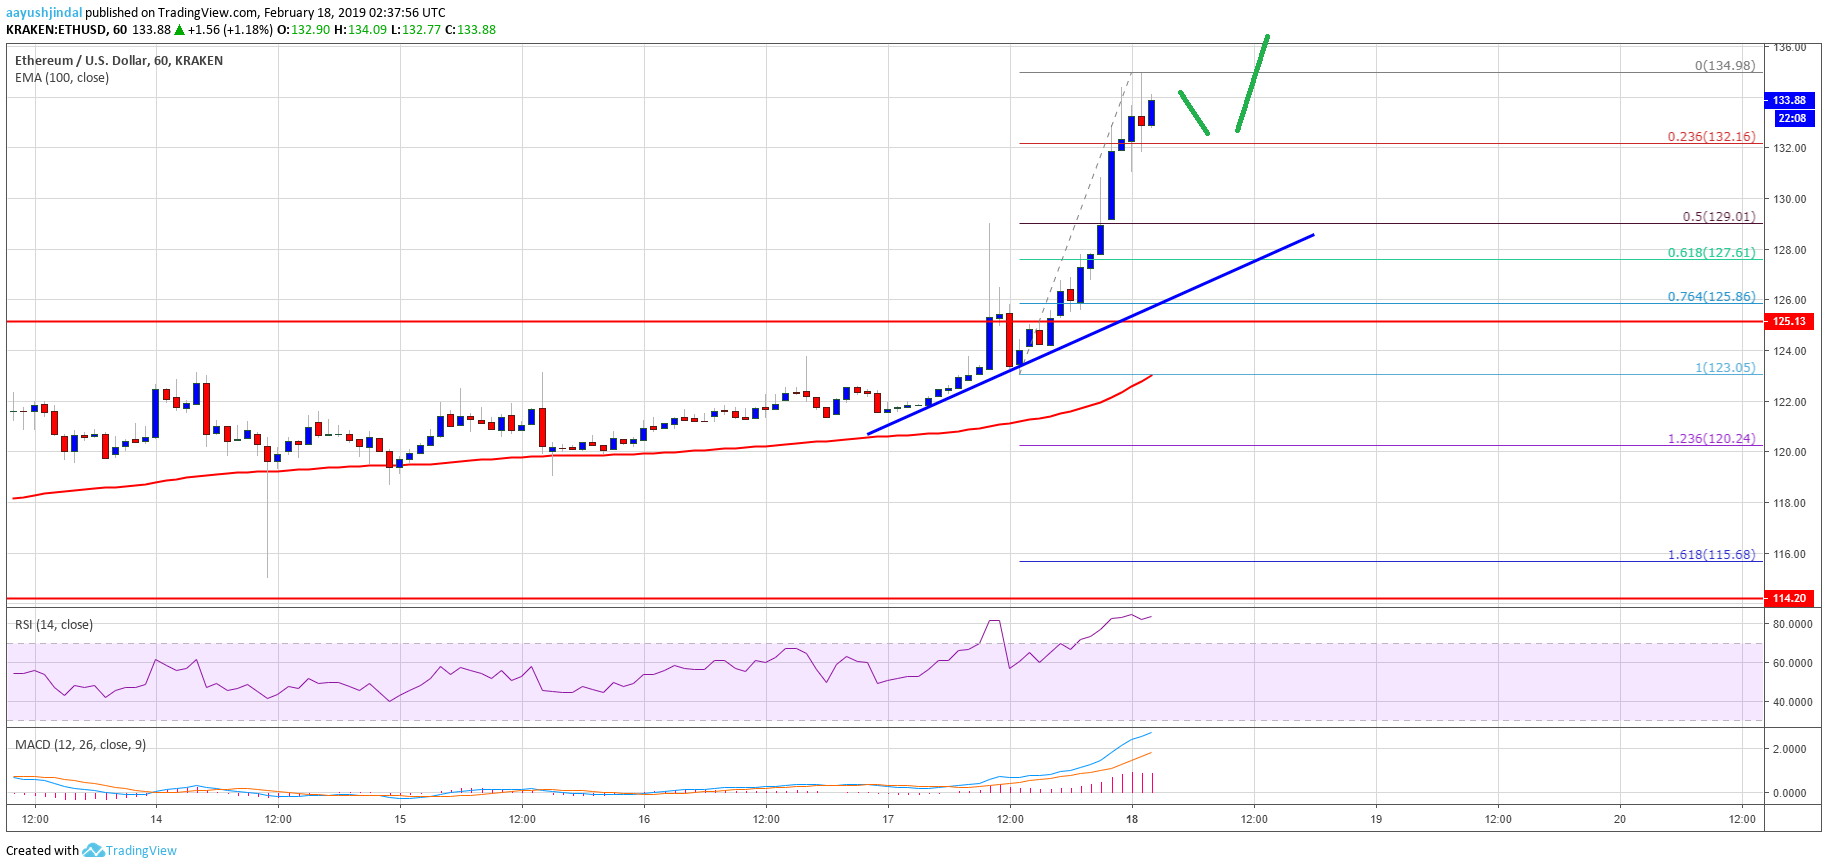
Looking at the chart, ETH price is gaining strength above the $132 resistance levels. It will most likely break the $135 level and extend gains in the coming sessions. The next target for buyers could be $140, followed by the $145 pivot level. On the downside, the main support is near $130, below which the price may perhaps test the $125 support zone.
ETH Technical Indicators
Hourly MACD – The MACD for ETH/USD is placed heavily in the bullish zone, with a positive bias.
Hourly RSI – The RSI for ETH/USD is currently near the overbought levels, with no major correction signal.
Major Support Level – $132, followed by $130
Major Resistance Level – $135 and $140