Reason to trust
How Our News is Made
Strict editorial policy that focuses on accuracy, relevance, and impartiality
Ad discliamer
Morbi pretium leo et nisl aliquam mollis. Quisque arcu lorem, ultricies quis pellentesque nec, ullamcorper eu odio.
- Ripple price is currently trading well below the $0.3045 and $0.3070 resistances against the US dollar.
- There is a major bearish trend line formed with resistance at $0.3070 on the hourly chart of the XRP/USD pair (data source from Kraken).
- Recently, there was a break below a connecting bullish trend line with support at $0.3000.
- The pair could correct a few points in the short term, but there are chances of a sharp drop to $0.2940 or $0.2910.
Ripple price continues to trade in a bearish zone against the US Dollar and Bitcoin. XRP/USD might dive towards the $0.2900 area before starting a fresh upward move.
Ripple Price Analysis
After trading as high as $0.3094, ripple price traded below the $0.3070 support against the US Dollar. The XRP/USD pair declined steadily and traded below the $0.3050 and $0.3040 support levels. There was a break below the 61.8% Fib retracement level of the last wave from the $0.2941 low to $0.3094 high. It opened the doors for more losses below the $0.3000 support. Later, there was a break below a connecting bullish trend line with support at $0.3000 on the hourly chart of the XRP/USD pair. The pair tested the $0.2970 swing low and later started trading in a range.
The price is currently trading well below the $0.3045 resistance and 100 hourly simple moving average. The recent low was $0.2971 and it seems like the price might correct higher in the short term. An initial resistance is near $0.3030 and the 50% Fib retracement level of the last drop from the $0.3094 high to $0.2971 low. However, the main resistance is near the $0.3070-0.3080 area. More importantly, there is a major bearish trend line formed with resistance at $0.3070 on the same chart. The 61.8% Fib retracement level of the last drop from the $0.3094 high to $0.2971 low is also near $0.3047 to act as a resistance. Therefore, if there is an upside correction, the price could face a strong resistance near $0.3045 and $0.3060.
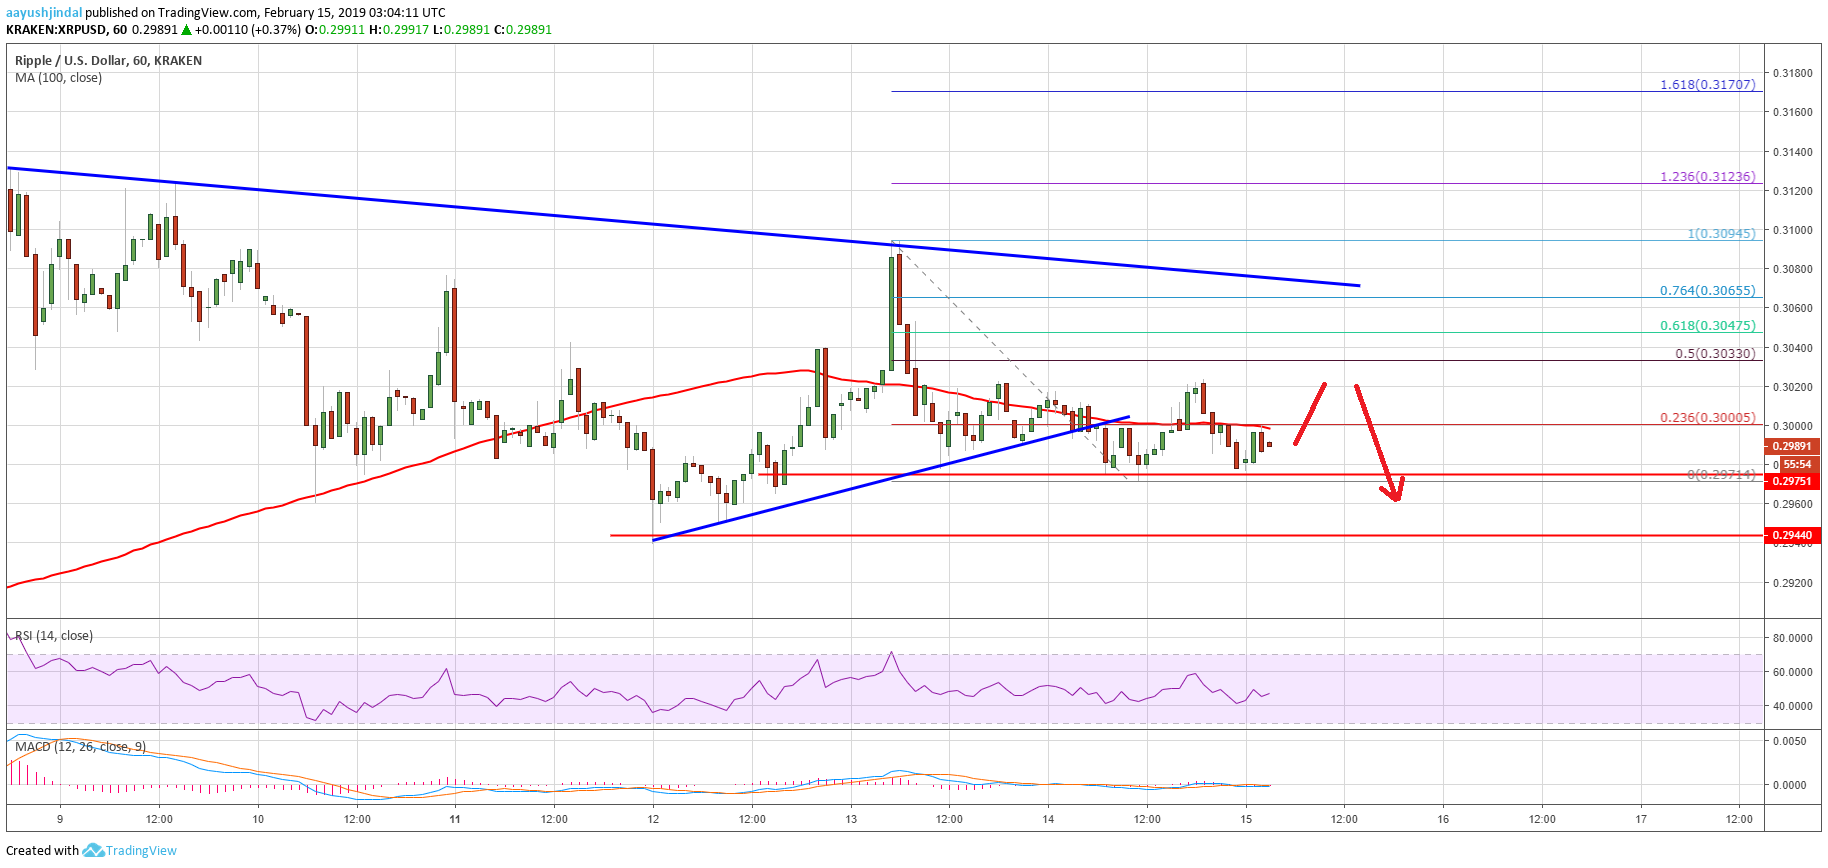
Looking at the chart, ripple price seems to be trading in a bearish zone below the $0.3060 resistance. If sellers gain control, there is a risk of a downside thrust below the $0.2970 low. The next support is at $0.2945, below which the price could drop towards the $0.2900 area. As long as the price is trading above the $0.2900 support zone, it is likely to bounce back above $0.3060 and $0.3100.
Technical Indicators
Hourly MACD – The MACD for XRP/USD is slowly moving in the bearish zone.
Hourly RSI (Relative Strength Index) – The RSI for XRP/USD is currently just below the 50 level, with a bullish angle.
Major Support Level – $0.2940
Major Resistance Level – $0.3060