Reason to trust
How Our News is Made
Strict editorial policy that focuses on accuracy, relevance, and impartiality
Ad discliamer
Morbi pretium leo et nisl aliquam mollis. Quisque arcu lorem, ultricies quis pellentesque nec, ullamcorper eu odio.
- Ripple price climbed higher, but it failed near the $0.3100 resistance area against the US dollar.
- There is a new connecting bullish trend line formed with support at $0.3000 on the hourly chart of the XRP/USD pair (data source from Kraken).
- The pair could break the $0.3000 support and accelerate losses towards $0.2910 in the near term.
Ripple price remained below key resistances against the US Dollar and Bitcoin. XRP/USD may correct higher, but upsides are likely to face a strong selling interest near $0.3100.
Ripple Price Analysis
In the past couple of days, there were bearish moves in ripple price below the $0.3120 pivot against the US Dollar. The XRP/USD pair made two attempts to surpass the $0.3100 and $0.3120 resistance levels, but it failed. On the other hand, bitcoin and Ethereum remained in the bullish zone above $3,550 and $120 respectively. Recently, there was an upward move above the $0.3050 level and the 100 hourly simple moving average. However, sellers protected gains near $0.3100 and a high was formed at $0.3094. Later, there was a sharp bearish reaction and the price declined below the $0.3040 support.
There was even a close below $0.3040 and the 100 hourly simple moving average. The price also traded below the 61.8% Fib retracement level of the last leg from the $0.2940 low to $0.3094 high. Somehow, buyers were able to protect the $0.3000 support area. The 76.4% Fib retracement level of the last leg from the $0.2940 low to $0.3094 high also acted as a support. At the outset, the price is trading just above the $0.3000 support, with a bearish angle. More importantly, there is a new connecting bullish trend line formed with support at $0.3000 on the hourly chart of the XRP/USD pair. If there is a downside break below the trend line and $0.2980, there could be more losses. The next support is positioned near the $0.2910 level. Additionally, the 1.236 Fib extension level of the last leg from the $0.2940 low to $0.3094 high is also near $0.2910.
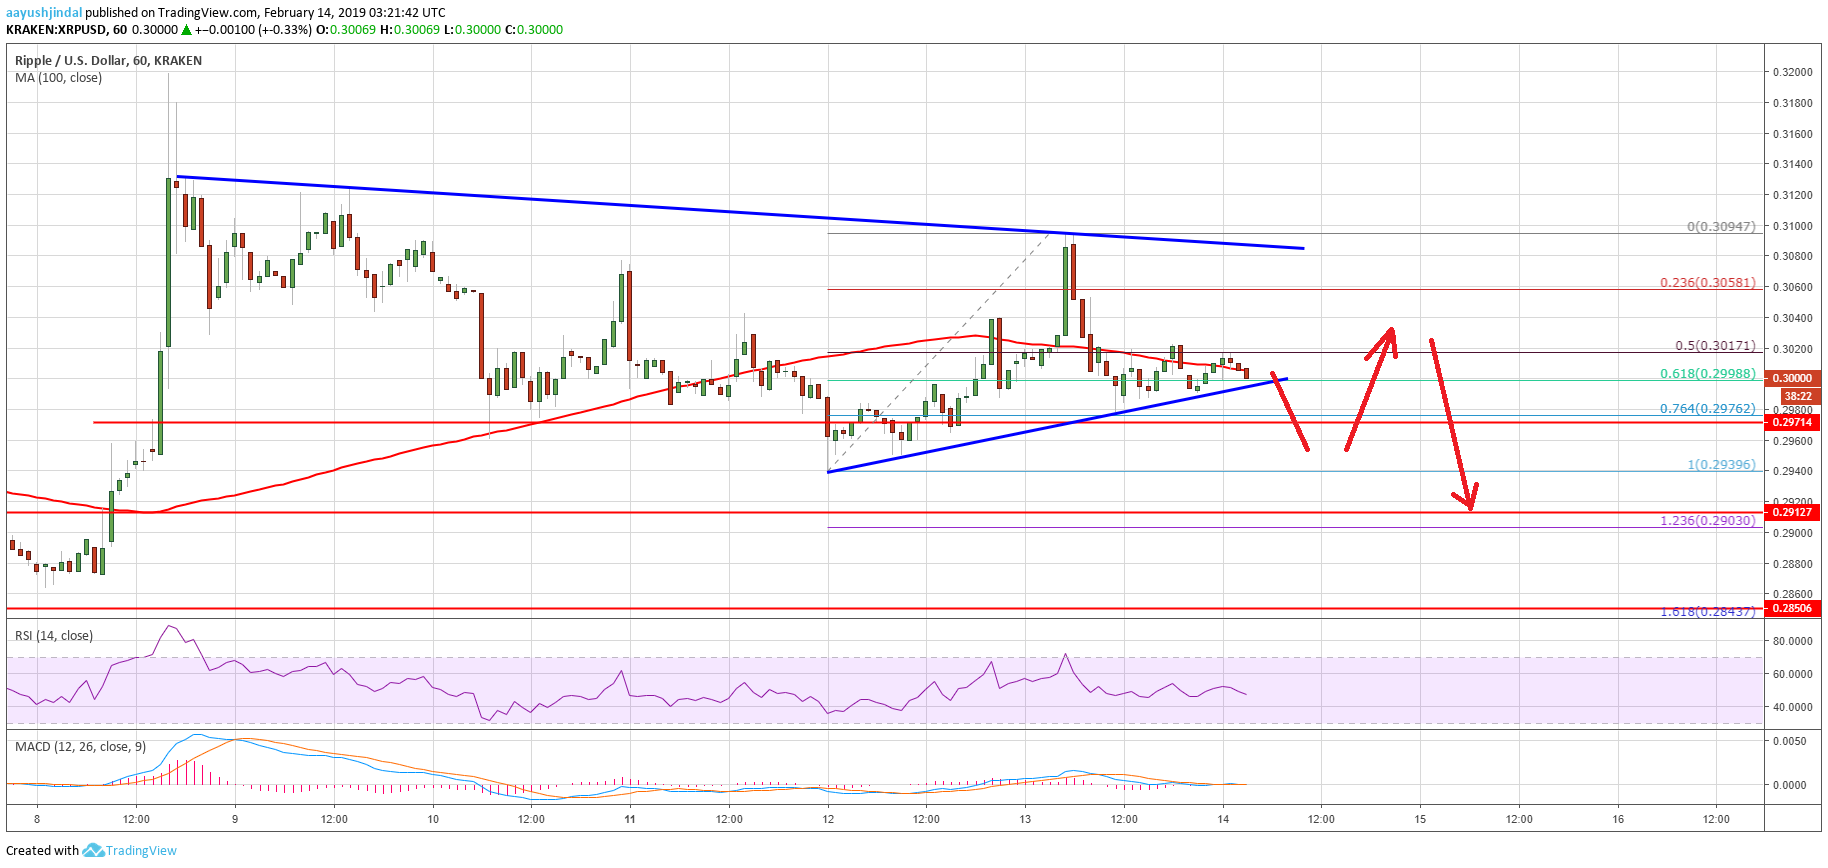
Looking at the chart, ripple price is clearly struggling to stay above the $0.3000 support area. Should sellers gain momentum, there is a risk of more losses towards $0.2915 and $0.2905. On the upside, the main hurdles for buyers are near $0.3040, $0.3050, $0.3090 and $0.3100. A close above $0.3100, followed by a follow through above $0.3120 is needed for a bullish acceleration.
Technical Indicators
Hourly MACD – The MACD for XRP/USD is showing a few negative signs in the bearish zone.
Hourly RSI (Relative Strength Index) – The RSI for XRP/USD moved below the 50 level, with a bearish angle.
Major Support Level – $0.2980
Major Resistance Level – $0.3040