Reason to trust
How Our News is Made
Strict editorial policy that focuses on accuracy, relevance, and impartiality
Ad discliamer
Morbi pretium leo et nisl aliquam mollis. Quisque arcu lorem, ultricies quis pellentesque nec, ullamcorper eu odio.
- Ripple price is currently showing a few positive signs above the $0.2980 support against the US dollar.
- Yesterday’s highlighted key declining channel is intact with resistance near $0.3035 on the hourly chart of the XRP/USD pair (data source from Kraken).
- The pair is likely to break the $0.3040 and $0.3060 resistance levels for a fresh upward move.
Ripple price is slowly recovering against the US Dollar and Bitcoin. XRP/USD could gain bullish momentum once it breaks the $0.3040 and $0.3060 resistance levels.
Ripple Price Analysis
In the past few days, there was a steady decline in ripple price from the $0.3180 swing high against the US Dollar. The XRP/USD pair traded below the $0.3120 and $0.3040 support levels. It even traded below the $0.3000 support to move into a bearish zone. There was a dip towards the $0.2940 level and the price settled below the 100 hourly simple moving average. A low was formed at $0.2939 and later the price started a short-term rebound. The price climbed above the $0.2980 resistance, with bullish moves.
The price even traded above the $0.3000 level, but the upside move was capped by the $0.3040 resistance. More importantly, yesterday’s highlighted key declining channel is intact with resistance near $0.3035 on the hourly chart of the XRP/USD pair. The pair traded as high as $0.3041 and it is currently trading near the 100 hourly SMA. An initial support is near $0.2990 and the 50% Fib retracement level of the recent wave from the $0.2939 low to $0.3041 high. However, the main support is near $0.2980 and the 61.8% Fib retracement level of the recent wave from the $0.2939 low to $0.3041 high. Therefore, if there is a downside correction, the price might find support near $0.3000, $0.2990 or $0.2980.
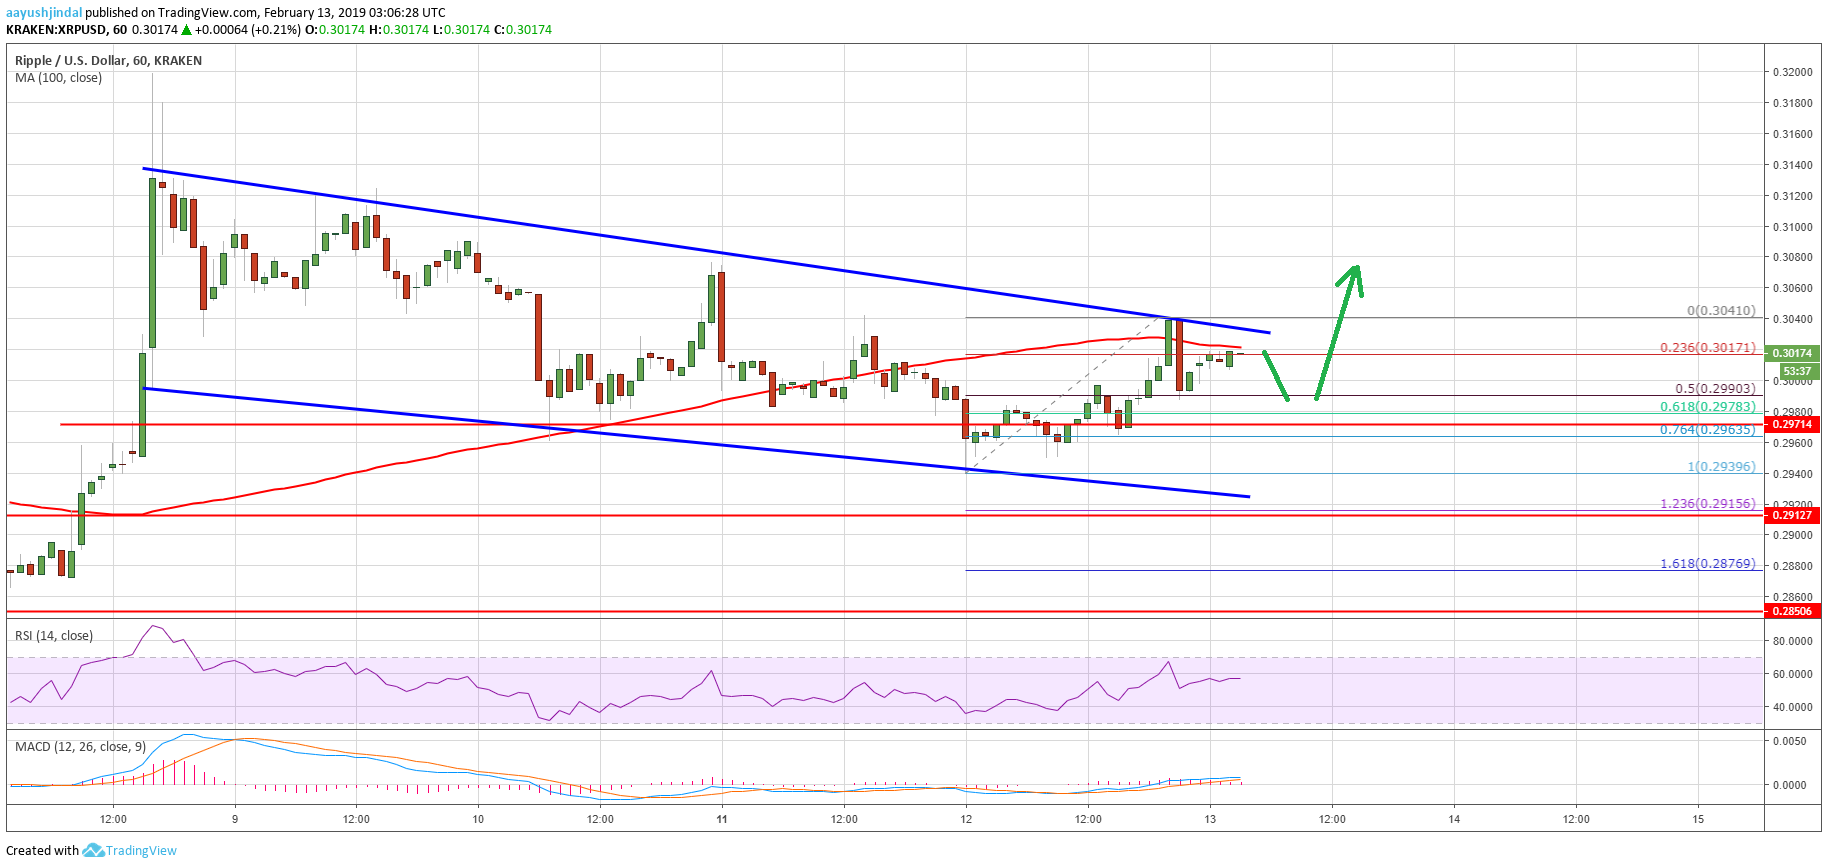
Looking at the chart, ripple price is showing a few positive signs above the $0.2980 support. Should buyers push the price above the $0.3040 resistance, there are chances of more gains towards $0.3060 and $0.3100.
Technical Indicators
Hourly MACD – The MACD for XRP/USD is slightly placed in the bullish zone.
Hourly RSI (Relative Strength Index) – The RSI for XRP/USD is now placed well above the 50 level.
Major Support Level – $0.2980
Major Resistance Level – $0.3040