
Reason to trust
How Our News is Made
Strict editorial policy that focuses on accuracy, relevance, and impartiality
Ad discliamer
Morbi pretium leo et nisl aliquam mollis. Quisque arcu lorem, ultricies quis pellentesque nec, ullamcorper eu odio.
- ETH price is slowly moving higher and it remains well supported near $119 against the US Dollar.
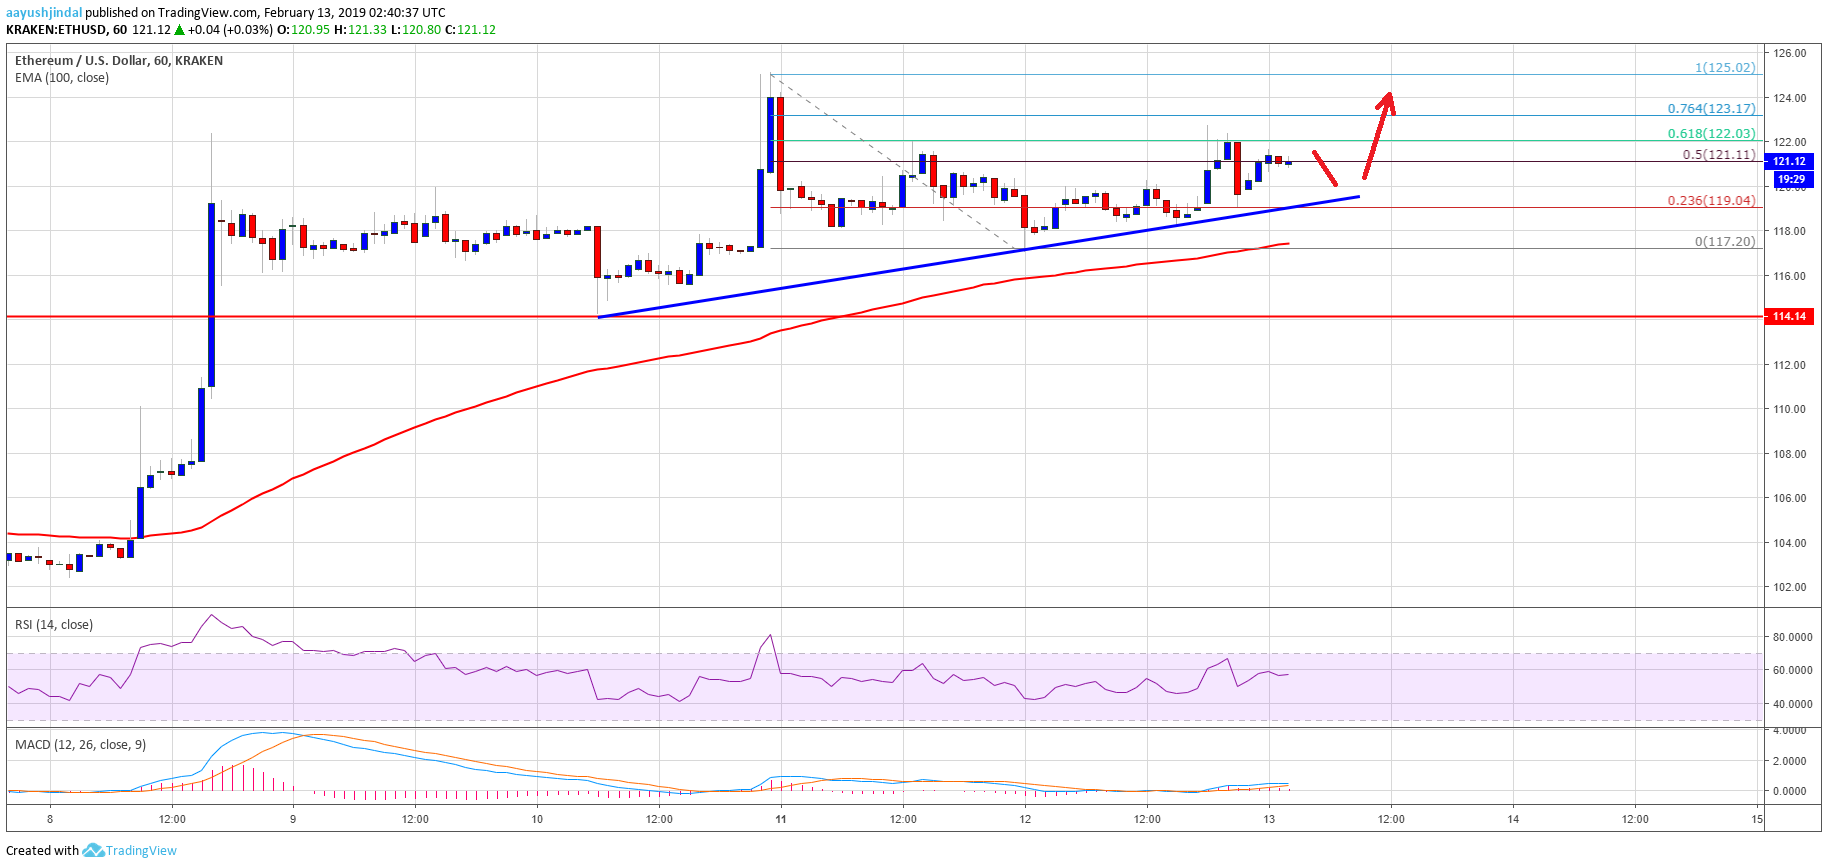
- There is a major bullish trend line formed with support at $119 on the hourly chart of ETH/USD (data feed via Kraken).
- The pair could dip a few points, but it is likely to find buyers near $119, $118 or $117 in the short term.
Ethereum price is placed nicely in a bullish trend against the US Dollar and bitcoin. ETH/USD may continue to move higher towards $125 and $128 in the coming sessions.
Ethereum Price Analysis
Recently, we saw a short term downside correction from the $125 high in ETH price against the US Dollar. The ETH/USD pair traded below the $122 and $120 support levels. However, the $117-118 area acted as a strong support and prevented further losses. Downsides were contained and later the price moved back above the $119 resistance level. Besides, there was a break above the 50% Fib retracement level of the recent drop from the $125 high to $117 swing low.
The price even spiked above the $121 level and it is currently well above the 100 hourly simple moving average. However, the recent upward move faced sellers near the $122-123 zone. Additionally, the 61.8% Fib retracement level of the recent drop from the $125 high to $117 swing low acted as a resistance. The price is currently placed well above $120 and it seems like it may continue to move higher. On the upside, the main resistances are near the $123 and $125 levels. On the downside, there is a major bullish trend line formed with support at $119 on the hourly chart of ETH/USD.
Looking at the chart, ETH price is clearly trading with a positive bias above $117 and $119. If there are corrective moves, buyers are likely to protect declines below $117. On the upside, a break above $125 might push the price towards the $128 level.
ETH Technical Indicators
Hourly MACD – The MACD for ETH/USD is currently moving in the bullish zone.
Hourly RSI – The RSI for ETH/USD is currently just below the 60 level, with a slight bearish angle.
Major Support Level – $119
Major Resistance Level – $123


