
Reason to trust
How Our News is Made
Strict editorial policy that focuses on accuracy, relevance, and impartiality
Ad discliamer
Morbi pretium leo et nisl aliquam mollis. Quisque arcu lorem, ultricies quis pellentesque nec, ullamcorper eu odio.
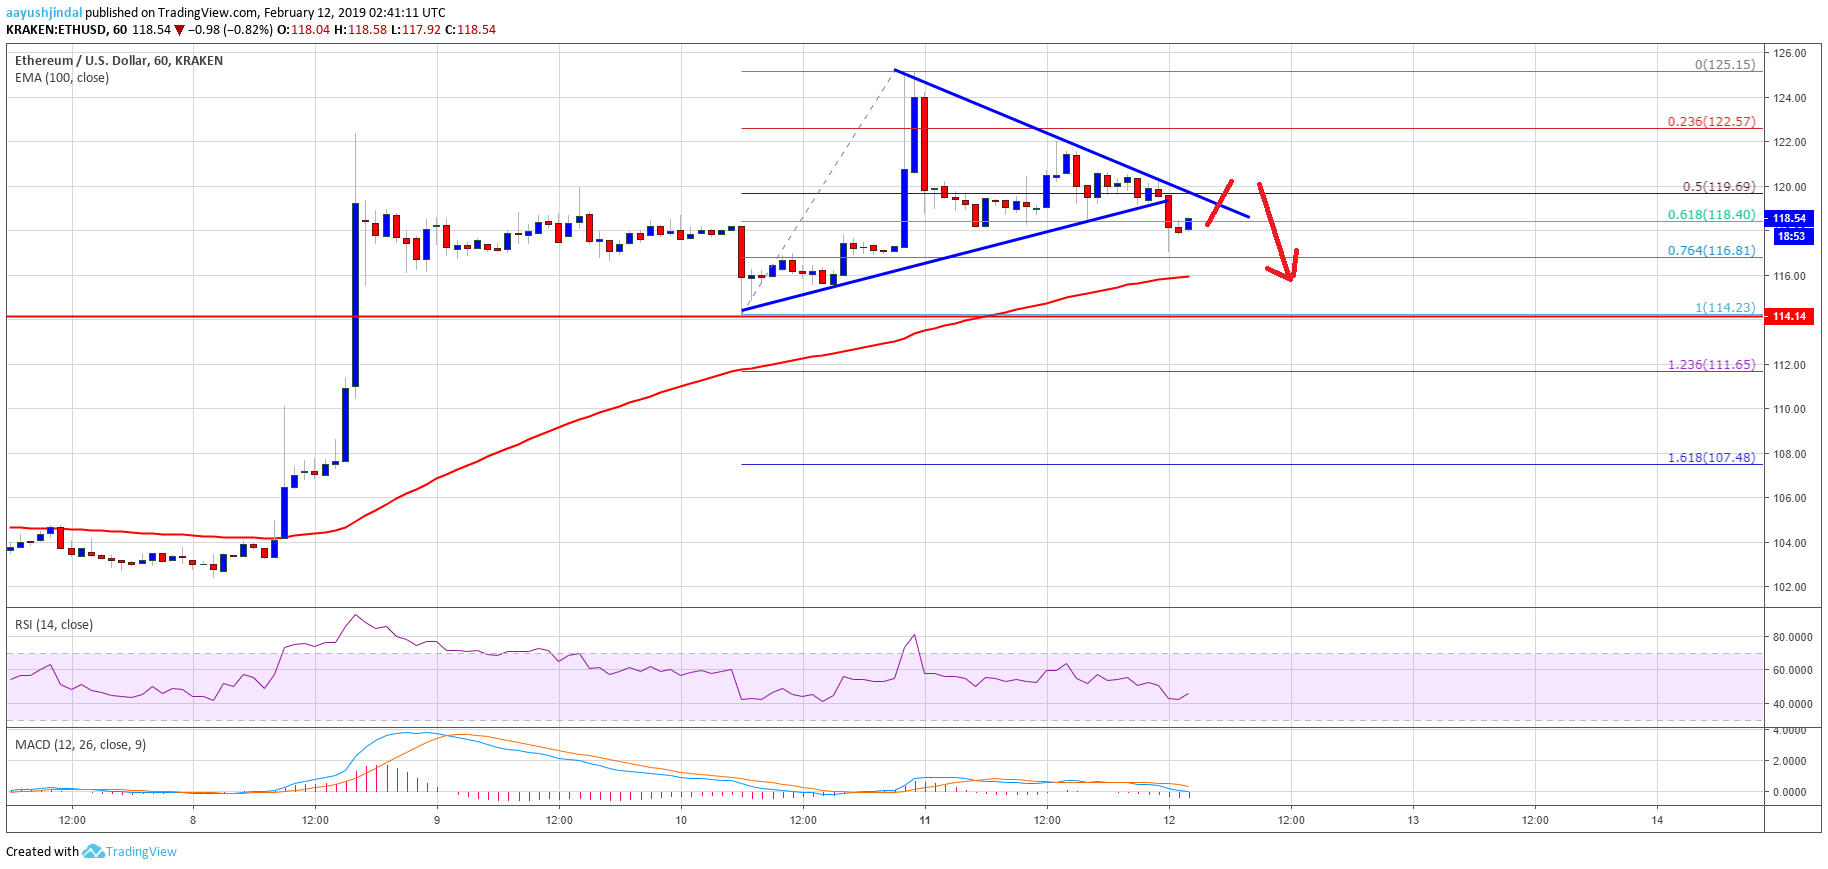
- ETH price remained in a range and consolidated above the $114 and $116 supports against the US Dollar.
- There was a break below a short term contracting triangle with support at $119 on the hourly chart of ETH/USD (data feed via Kraken).
- The pair might continue to consolidate and it could even test the $114 support area in the near term.
Ethereum price is showing signs of extended consolidation against the US Dollar and bitcoin. ETH/USD could decline towards the $114 support before the next upward move.
Ethereum Price Analysis
Recently, we saw a decent upward move in ETH price above the $122 level against the US Dollar. The ETH/USD pair tested the $125 resistance zone and later corrected lower. It declined below the $124 and $122 levels to start a short term downside correction. There was a break below the 50% Fib retracement level of the last leg from the $115 swing low to $125 high. The price even traded below the $120 level, but it stayed above the 100 hourly simple moving average.
Moreover, there was a break below a short term contracting triangle with support at $119 on the hourly chart of ETH/USD. The pair tested the $117 level, where buyers emerged. Besides, it traded close to the 76.4% Fib retracement level of the last leg from the $115 swing low to $125 high. The pair is currently trading above the $116 support, with a few bearish signs. To climb higher, the price must break the $122 and $123 resistance levels. On the other hand, if it fails to move past $122, ETH sellers may push the price towards the $114 support.
Looking at the chart, ETH price is placed nicely above the $114 support and the 100 hourly SMA. Going forward, there could be range moves above $114 before the price makes the next move. It could either break the $122 resistance or extend the downside correction below $114.
ETH Technical Indicators
Hourly MACD – The MACD for ETH/USD moved back in the bearish zone.
Hourly RSI – The RSI for ETH/USD is currently moving higher towards the 50 level, with a bullish angle.
Major Support Level – $116
Major Resistance Level – $122


