Reason to trust
How Our News is Made
Strict editorial policy that focuses on accuracy, relevance, and impartiality
Ad discliamer
Morbi pretium leo et nisl aliquam mollis. Quisque arcu lorem, ultricies quis pellentesque nec, ullamcorper eu odio.
- Bitcoin price corrected lower recently below the $3,640 and $3,580 supports against the US Dollar.
- There is a contracting triangle forming with resistance near $3,625 on the hourly chart of the BTC/USD pair (data feed from Kraken).
- The price could either climb above the $3,625 resistance or extend the correction below $3,560.
Bitcoin price declined recently below the $3,580 support against the US Dollar. BTC found support near $3,550 and it seems like the market is preparing for the next move in the near term.
Bitcoin Price Analysis
After trading above the $3,700 resistance, bitcoin price started a downside correction against the US Dollar. The BTC/USD pair topped at $3,745 and later corrected below $3,700 and $3,640. There was a break below the 23.6% Fib retracement level of the last leg from the $3,340 swing low to $3,745 high. More importantly, there was a break below the $3,600 and $3,580 support levels. The price traded close to the $3,550 support area, where buyers emerged.
There was a complete test of the 50% Fib retracement level of the last leg from the $3,340 swing low to $3,745 high. Besides, the 100 hourly simple moving average acted as a strong support and prevented additional losses below $3,540. The price bounced back, but the previous supports at $3,580 and $3,600 are acting as resistances. More importantly, there is a contracting triangle forming with resistance near $3,625 on the hourly chart of the BTC/USD pair. A successful break above the $3,600 and $3,620 resistances could set the pace for more gains in the near term. The next key resistances are $3,700 and $3,750. On the other hand, a close below $3,550 might open the doors for a drop to $3,500 or $3,440.
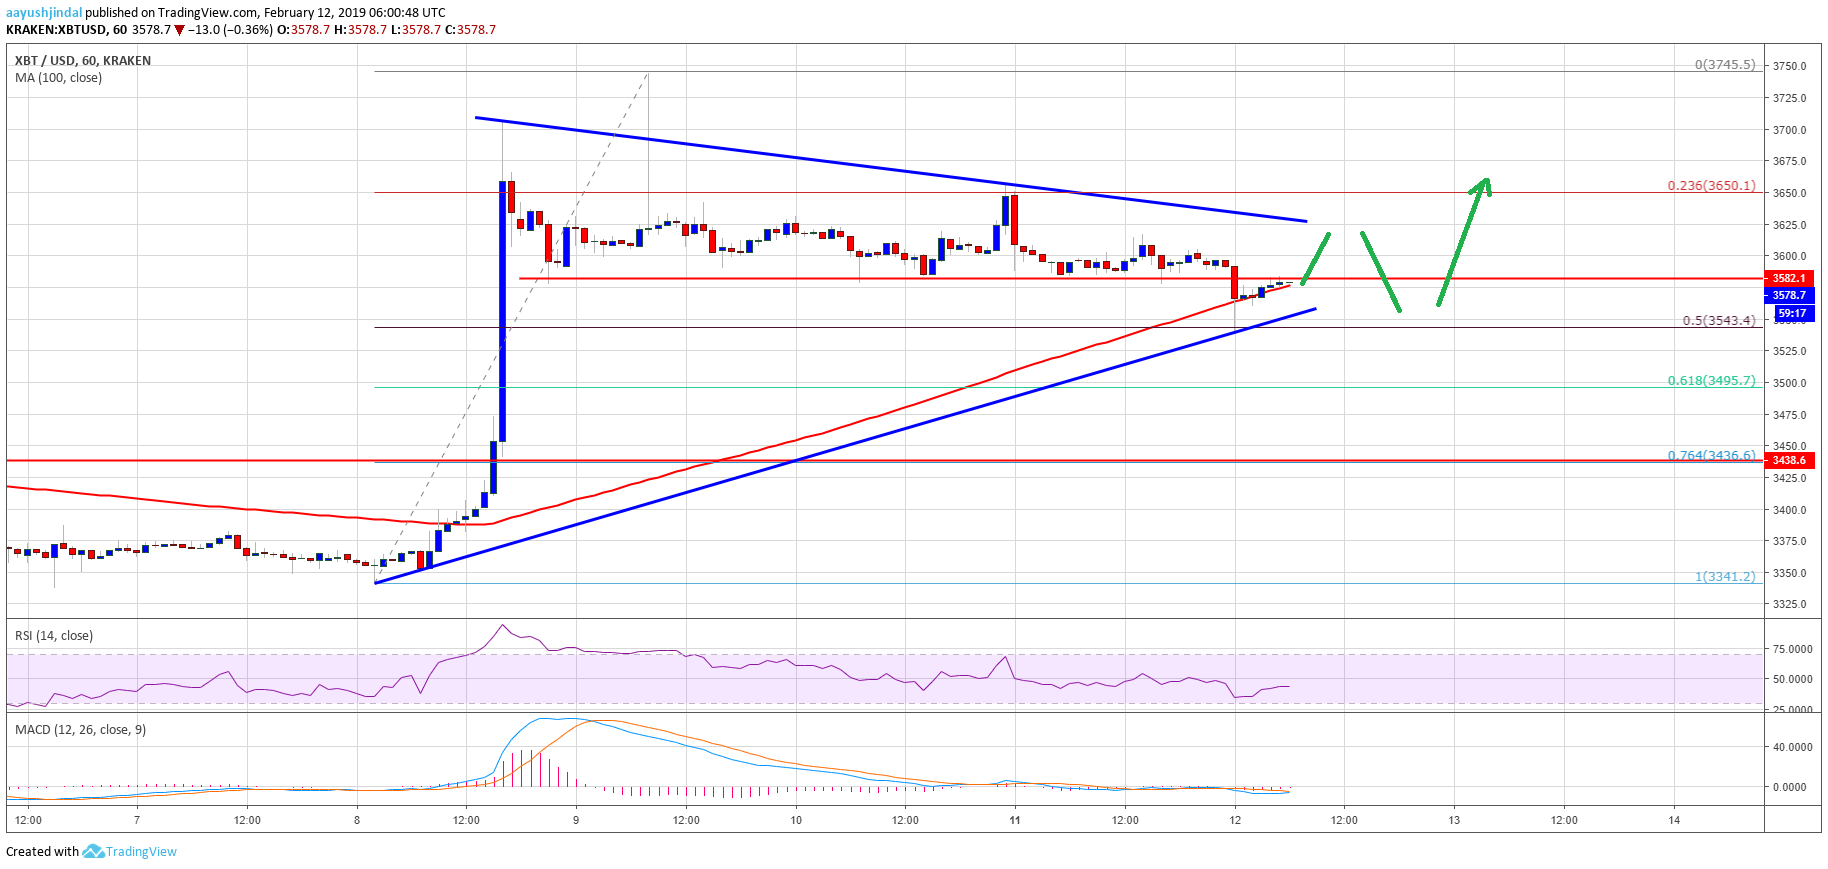
Looking at the chart, bitcoin price is likely preparing for the next break either above $3,625 or below $3,550. It seems like buyers could gain control as long as the price is above $3,550 and the 100 hourly SMA.
Technical indicators
Hourly MACD – The MACD is about to move back in the bullish zone.
Hourly RSI (Relative Strength Index) – The RSI for BTC/USD is still below the 50 level, which is a negative sign.
Major Support Level – $3,550
Major Resistance Level – $3,625