
Reason to trust
How Our News is Made
Strict editorial policy that focuses on accuracy, relevance, and impartiality
Ad discliamer
Morbi pretium leo et nisl aliquam mollis. Quisque arcu lorem, ultricies quis pellentesque nec, ullamcorper eu odio.
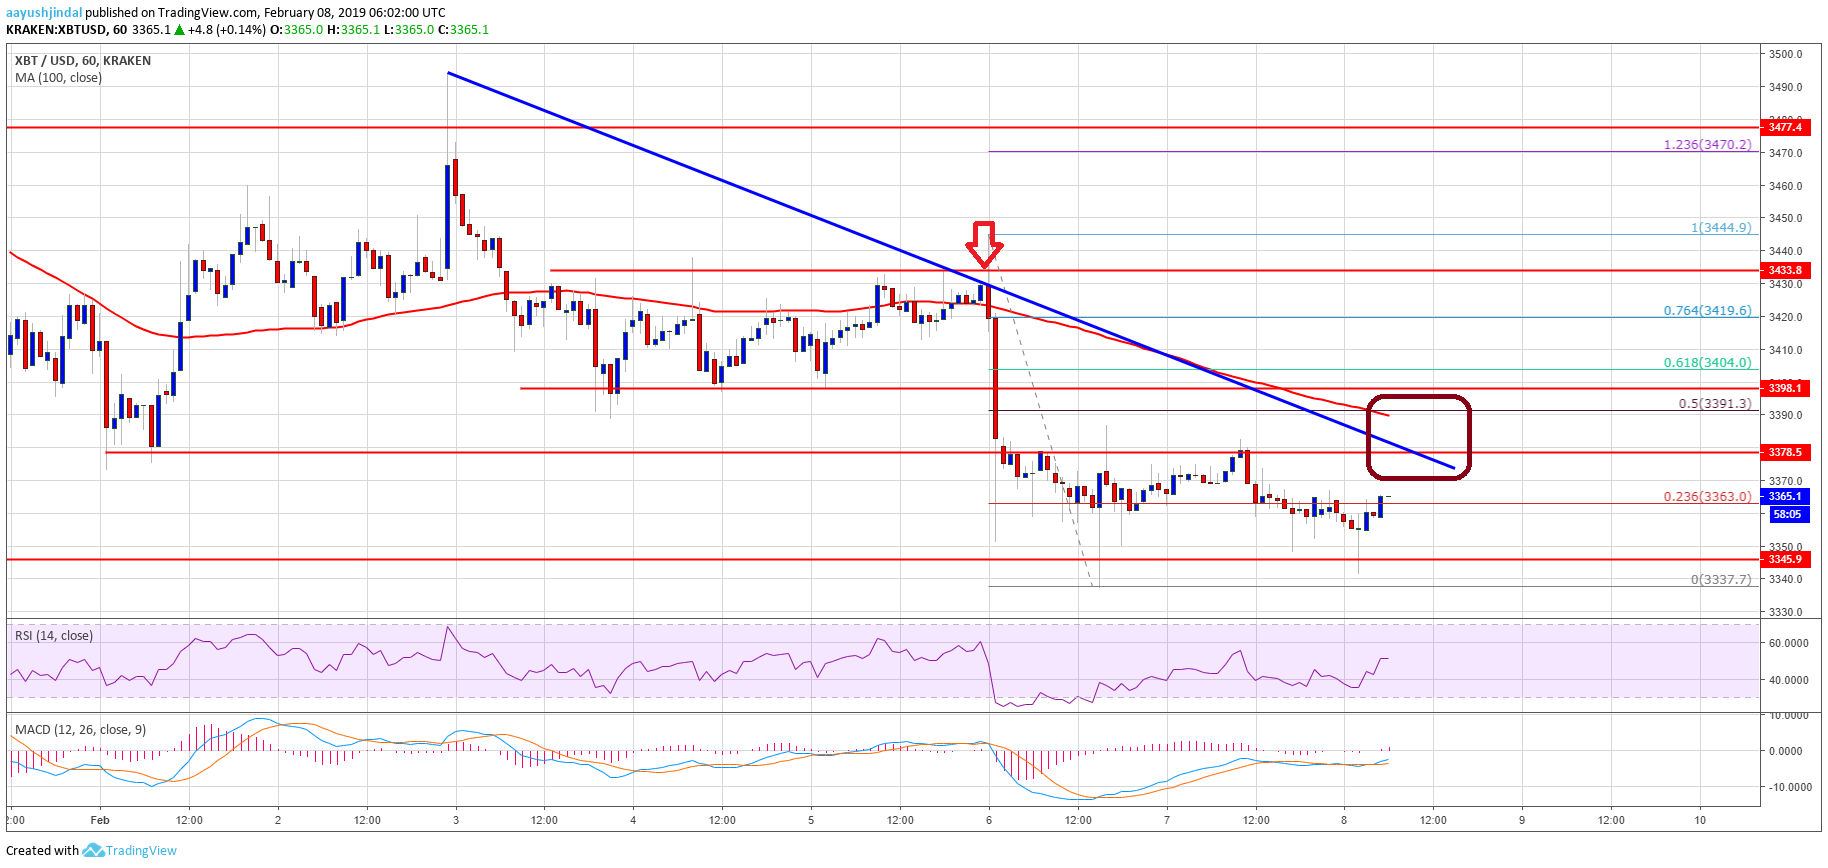
- Bitcoin price is trading in a range above the $3,345 support level against the US Dollar.
- There is a major bearish trend line formed with resistance at $3,375 on the hourly chart of the BTC/USD pair (data feed from Kraken).
- The price is likely to face a strong resistance near the $3,375 and $3,400 levels.
Bitcoin price is currently consolidating losses above $3,340 against the US Dollar. BTC could correct a few points, but upsides are likely to remain capped near $3,400.
Bitcoin Price Analysis
There was a short-term support formed near the $3,345 level in bitcoin price against the US Dollar. The BTC/USD pair corrected a few points and traded above the $3,360 and $3,370 levels. There was a break above the 23.6% Fib retracement level of the recent decline from the $3,444 high to $3,337 low. The price even spiked above the $3,375 resistance, but it failed to hold gains. Sellers defended gains above the $3,380 and $3,400 levels. As a result there was a fresh dip and the price retested the $3,345 support.
It is currently correcting higher towards the $3,375 and $3,380 resistances. There is also a major bearish trend line formed with resistance at $3,375 on the hourly chart of the BTC/USD pair. The 50% Fib retracement level of the recent decline from the $3,444 high to $3,337 low is also near $3,391. Finally, the 100 hourly simple moving average is positioned near the $3,390 level to act as a solid resistance. Therefore, it seems like there are many hurdles on the upside near $3,375, $3,390 and $3,400. On the downside, the key support is at $3,345, below which the price could break the $3,337 swing low.
Looking at the chart, bitcoin price is trading in a bearish zone below $3,400. If buyers gain traction above $3,375, $3,390 and $3,400, there could be a decent upward move towards $3,500 in the near term.
Technical indicators
Hourly MACD – The MACD is slowly moving in the bullish zone, with lack of positive signs.
Hourly RSI (Relative Strength Index) – The RSI for BTC/USD is currently positioned above the 50 level.
Major Support Level – $3,345
Major Resistance Level – $3,400


