
Reason to trust
How Our News is Made
Strict editorial policy that focuses on accuracy, relevance, and impartiality
Ad discliamer
Morbi pretium leo et nisl aliquam mollis. Quisque arcu lorem, ultricies quis pellentesque nec, ullamcorper eu odio.
- Ripple price is under pressure and it recently broke the $0.2980 support level against the US dollar.
- There is a major bearish trend line formed with resistance near $0.2980 on the hourly chart of the XRP/USD pair (data source from Kraken).
- The pair could accelerate losses if there is a downside break below the $0.2940 support in the near term.
Ripple price declined further and broke key supports against the US Dollar and Bitcoin. XRP/USD is currently at a risk of a downside break below the $0.2940 and $0.2920 supports.
Ripple Price Analysis
Yesterday, we saw a downside reaction in ripple price below the $0.3110 support level against the US Dollar. The XRP/USD pair declined below the $0.3050 and $0.3000 support levels to enter a bearish zone. Later, the price even broke the $0.2980 support and the 100 hourly simple moving average. It tested the $0.2940 support area and later started a short term upside correction. It recovered above the $0.2980 resistance and the $0.3000 level. There was a break above the 23.6% Fib retracement level of the recent decline from the $0.3110 high to $0.2940 low.
However, the price failed to gain momentum above the $0.3000 and $0.3020 levels. There was no test of the 50% Fib retracement level of the recent decline from the $0.3110 high to $0.2940 low. The price remained well below the $0.3025 resistance and the 100 hourly simple moving average. Besides, there is a major bearish trend line formed with resistance near $0.2980 on the hourly chart of the XRP/USD pair. To start a decent recovery, the price must break the trend line, $0.3000, and the 100 hourly SMA. The next key resistances are positioned near $0.3025 and $0.3045.
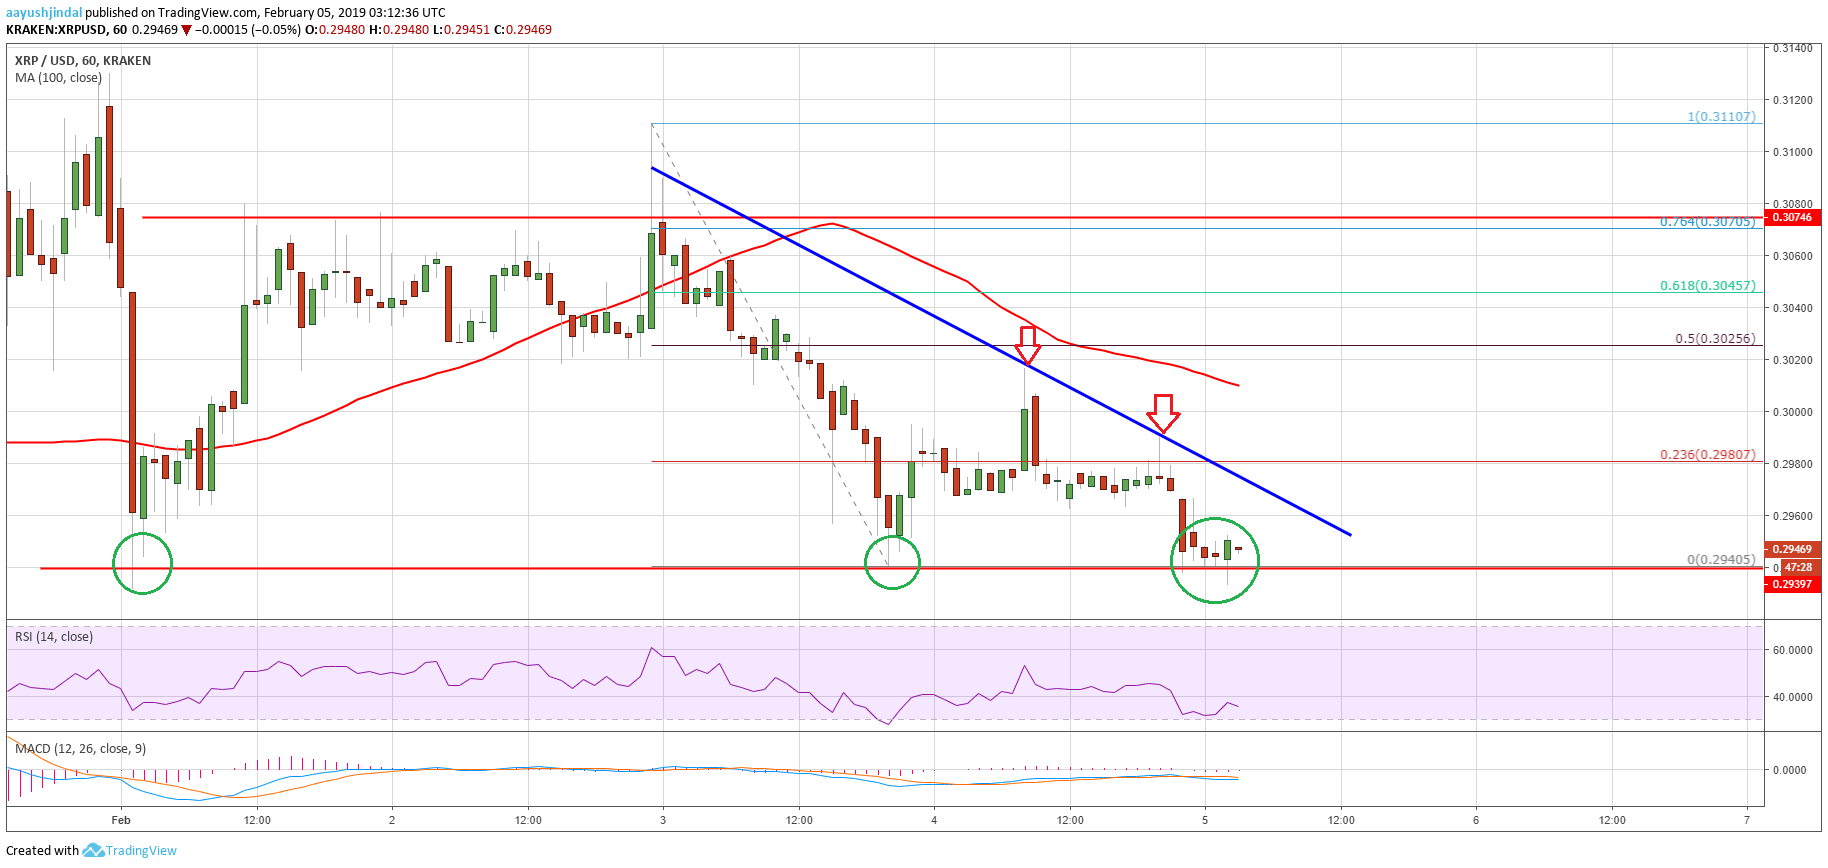
Looking at the chart, ripple price is currently trading near a crucial support at $0.2940. If there is a downside break, the price might accelerate losses below the $0.2920 and $0.2900 levels in the near term.
Technical Indicators
Hourly MACD – The MACD for XRP/USD is currently gaining momentum in the bearish zone.
Hourly RSI (Relative Strength Index) – The RSI for XRP/USD is struggling to recover above the 40 level.
Major Support Level – $0.2940
Major Resistance Level – $0.3025


