
Reason to trust
How Our News is Made
Strict editorial policy that focuses on accuracy, relevance, and impartiality
Ad discliamer
Morbi pretium leo et nisl aliquam mollis. Quisque arcu lorem, ultricies quis pellentesque nec, ullamcorper eu odio.
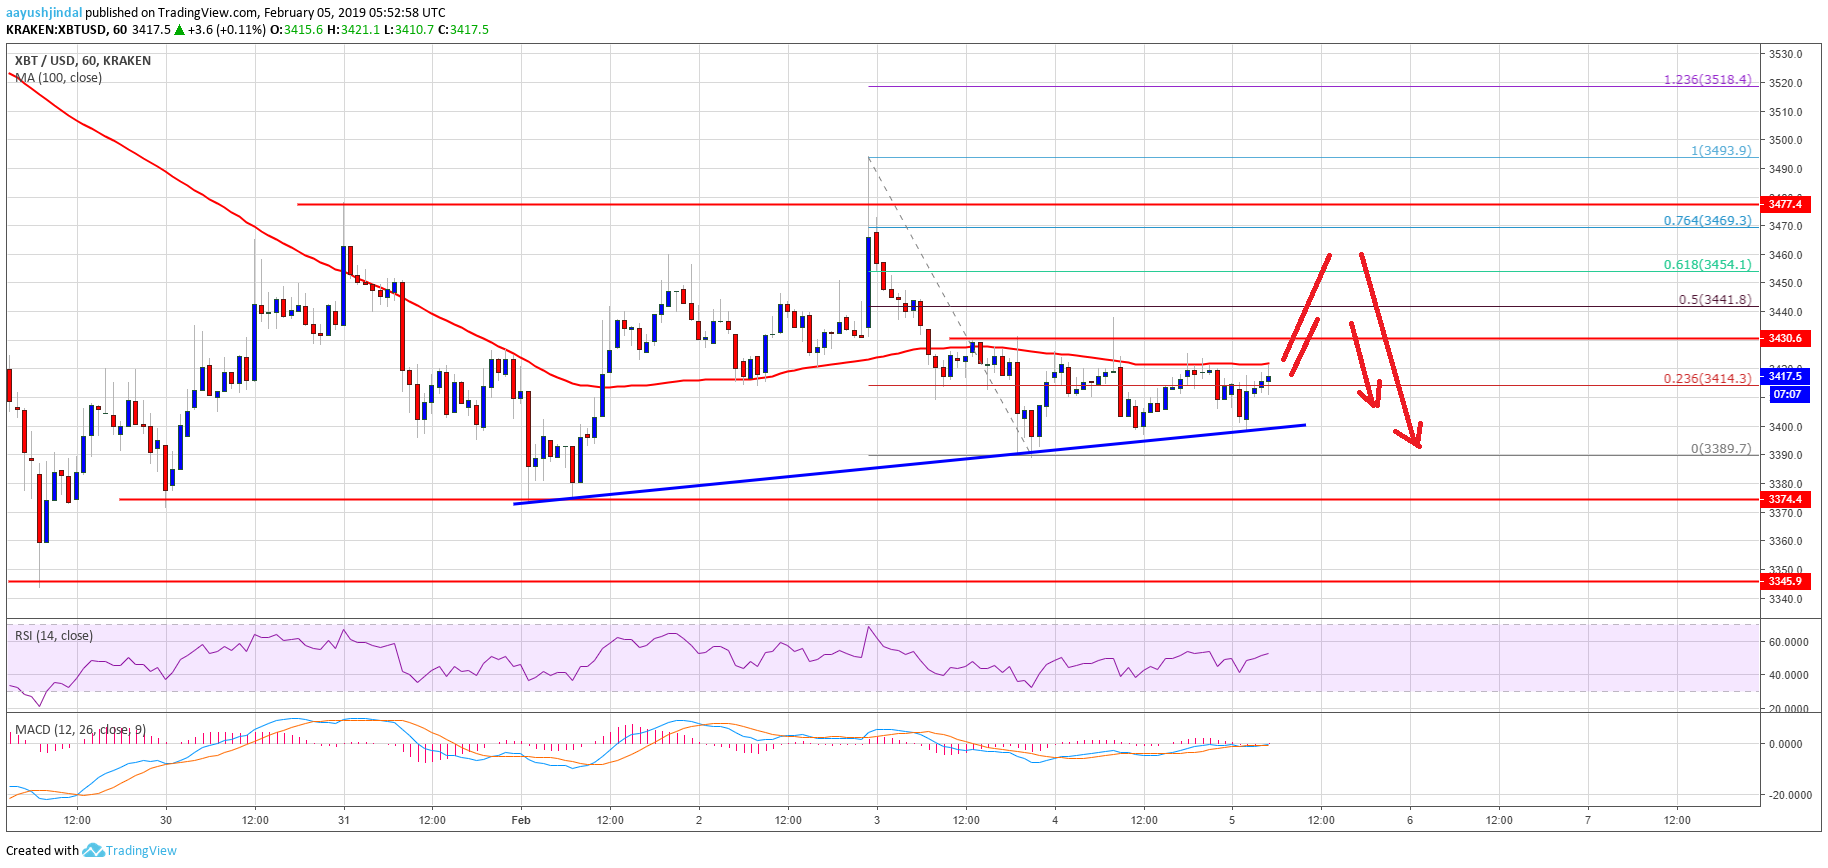
- Bitcoin price trading in a tight range above the $3,375 support area against the US Dollar.
- There is a key connecting bullish trend line formed with support at $3,400 on the hourly chart of the BTC/USD pair (data feed from Kraken).
- The price might correct higher in the short term towards the $3,430 and $3,350 resistances.
Bitcoin price is struggling to gain bullish momentum above $3,450 against the US Dollar. BTC price might continue to trade in a range until trading volumes and volatility picks up.
Bitcoin Price Analysis
In the past three sessions, there were mostly range moves in bitcoin price above the $3,375 support against the US Dollar. The BTC/USD pair stayed above the $3,400 support level and trading in a $25 range. It moved above the 23.6% Fib retracement level of the last drop from the $3,494 swing high to $3,390 low. However, the price struggled to gain momentum above $3,430 and the 100 hourly simple moving average. The current price action is neutral-to-bearish, with resistances near $3,430 and $3,450.
An intermediate resistance is near the $3,440 level. It represents the 50% Fib retracement level of the last drop from the $3,494 swing high to $3,390 low. If there is a successful break above the $3,440 and $3,450 resistance levels, the price might trade towards the $3,480 resistance. On the downside, an initial support is near the $3,400 level. There is also a key connecting bullish trend line formed with support at $3,400 on the hourly chart of the BTC/USD pair. Below the trend line support, the pair could trade towards the $3,375 support level. The next key support is at $3,350 and $3,345.
Looking at the chart, bitcoin price might continue to trade in a range, with bullish moves toward $3,440. Having said that, a solid upward move requires an increase in volatility and volume. If not, there is a risk of a bearish break towards $3,320.
Technical indicators
Hourly MACD – The MACD is currently flat in the bearish zone.
Hourly RSI (Relative Strength Index) – The RSI for BTC/USD is currently above the 50 level, with a bullish angle.
Major Support Level – $3,400
Major Resistance Level – $3,440


