Reason to trust
How Our News is Made
Strict editorial policy that focuses on accuracy, relevance, and impartiality
Ad discliamer
Morbi pretium leo et nisl aliquam mollis. Quisque arcu lorem, ultricies quis pellentesque nec, ullamcorper eu odio.
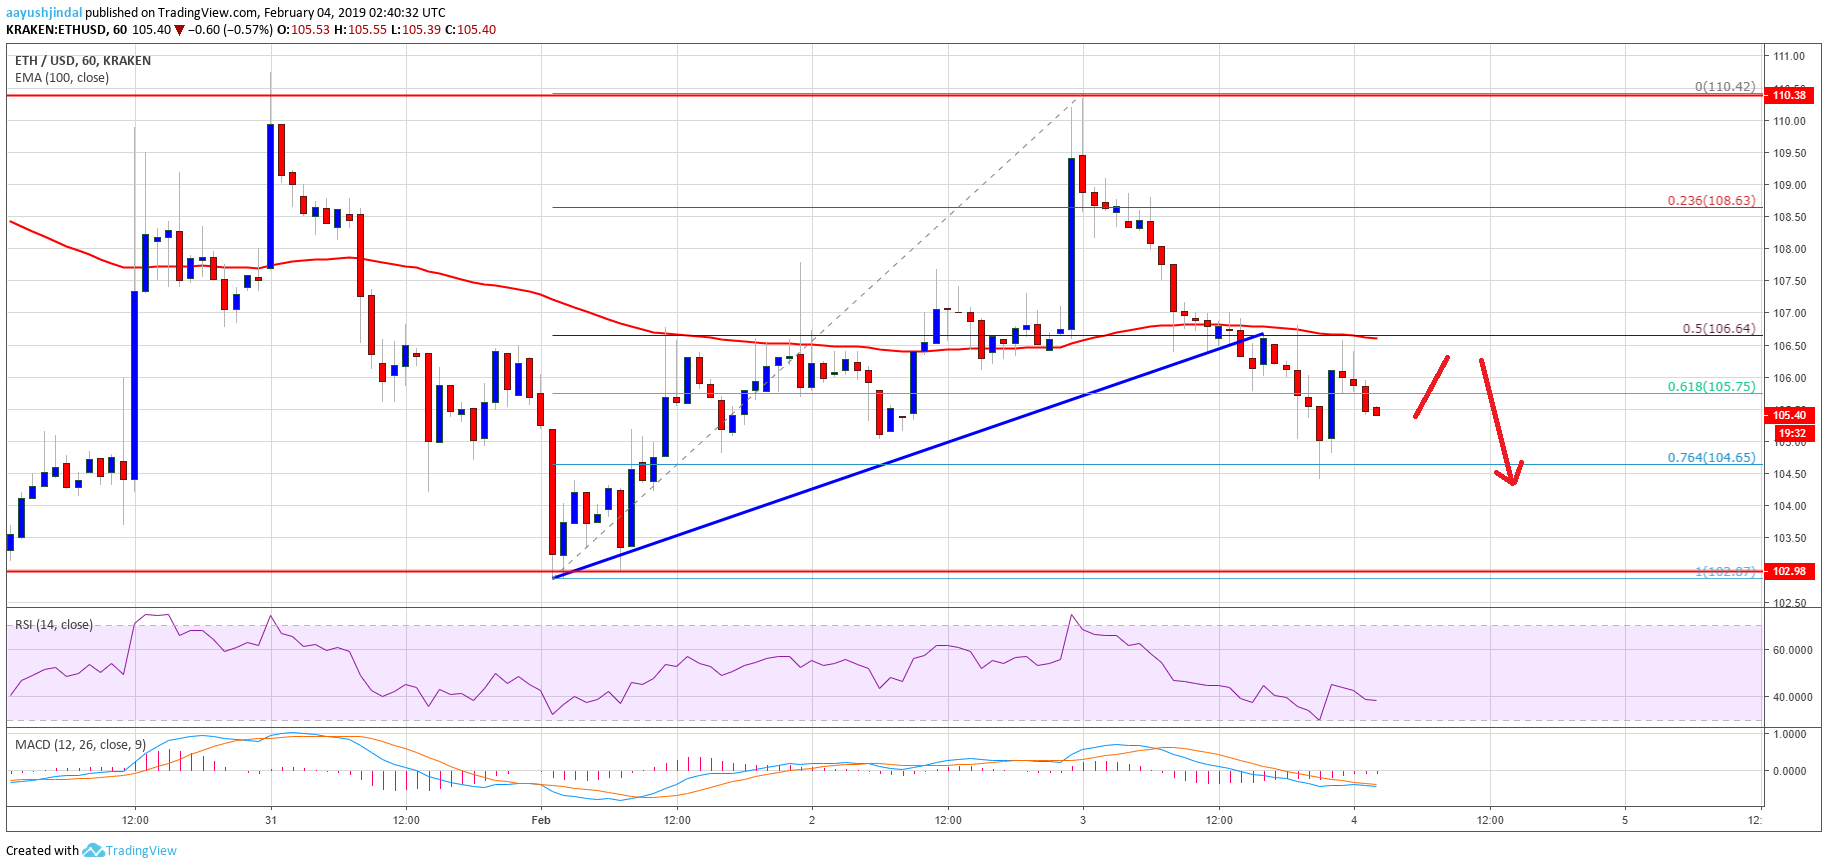
- ETH price struggled to settle above the $108 resistance area and declined recently against the US Dollar.
- There was a break below a key bullish trend line with support at $106 on the hourly chart of ETH/USD (data feed via Kraken).
- The pair is now trading well below the $108 resistance and the 100 hourly simple moving average.
Ethereum price failed to gain momentum and moved back in a bearish zone against the US Dollar and bitcoin. ETH/USD could revisit the $102 support area in the near term.
Ethereum Price Analysis
This past week, ETH price found support near the $102 level and later recovered against the US Dollar. The ETH/USD pair traded above the $106 and $108 resistance levels. There was also a close above the $108 level and the 100 hourly simple moving average. However, the price failed to break the $110 resistance level and later started a fresh decline. It moved below the 50% Fib retracement level of the last wave from the $102 low to $110 high. Besides, there was a break below $106 and the 100 hourly simple moving average.
The decline was strong as the price tested the $105 support level. More importantly, there was a break below a key bullish trend line with support at $106 on the hourly chart of ETH/USD. The pair tested the 76.4% Fib retracement level of the last wave from the $102 low to $110 high. At the moment, the price is correcting higher, but the previous support near $106 is acting as a resistance. Moreover, the 100 hourly SMA is acting as a strong barrier near the $106-107 zone. Therefore, a proper break above the $106, $107 and $108 levels is must for a decent upward move.
Looking at the chart, ETH price seems to be trading in a broad range above the $102 support. If there is a downside break below $102 and $101, the price could test the $95 level.
ETH Technical Indicators
Hourly MACD – The MACD for ETH/USD is back in the bearish zone.
Hourly RSI – The RSI for ETH/USD moved below the 40 level, with a bearish angle.
Major Support Level – $102
Major Resistance Level – $107