Reason to trust
How Our News is Made
Strict editorial policy that focuses on accuracy, relevance, and impartiality
Ad discliamer
Morbi pretium leo et nisl aliquam mollis. Quisque arcu lorem, ultricies quis pellentesque nec, ullamcorper eu odio.
- Ripple price remained below the $0.2900 and $0.2950 resistance levels against the US dollar.
- There are two bearish trend lines in place with resistance near $0.2900 on the hourly chart of the XRP/USD pair (data source from Kraken).
- The pair remains at a risk of more losses as long as it is trading below the$0.2900 and $0.2950 resistance levels.
Ripple price is facing a lot of hurdles on the upside against the US Dollar and Bitcoin. XRP/USD is likely to extend the current decline below $0.2800 unless buyers push it above $0.2950.
Ripple Price Analysis
Yesterday, there was a minor upside correction from the $0.2776 low in ripple price against the US Dollar. The XRP/USD pair traded above the $0.2800 and $0.2850 levels. It also moved above the 38.2% Fib retracement level of the last decline from the $0.3070 high to $0.2776 low. However, the price failed to gain strength above the $0.2950 resistance and remained below the 100 hourly simple moving average. Later, there was a fresh decline and the price traded below $0.2900.
Sellers pushed the price below the 61.8% Fib retracement level of the recent wave from the $0.2776 low to $0.2946 high. The current price is slightly bearish, with many hurdles on the upside near $0.2900 and $0.2950. There are also two bearish trend lines in place with resistance near $0.2900 on the hourly chart of the XRP/USD pair. A clear break and close above these trend lines is needed for a recovery above $0.3000. If not, there is a risk of a downside break below the $0.2820 support level. It may even break the 76.4% Fib retracement level of the recent wave from the $0.2776 low to $0.2946 high.
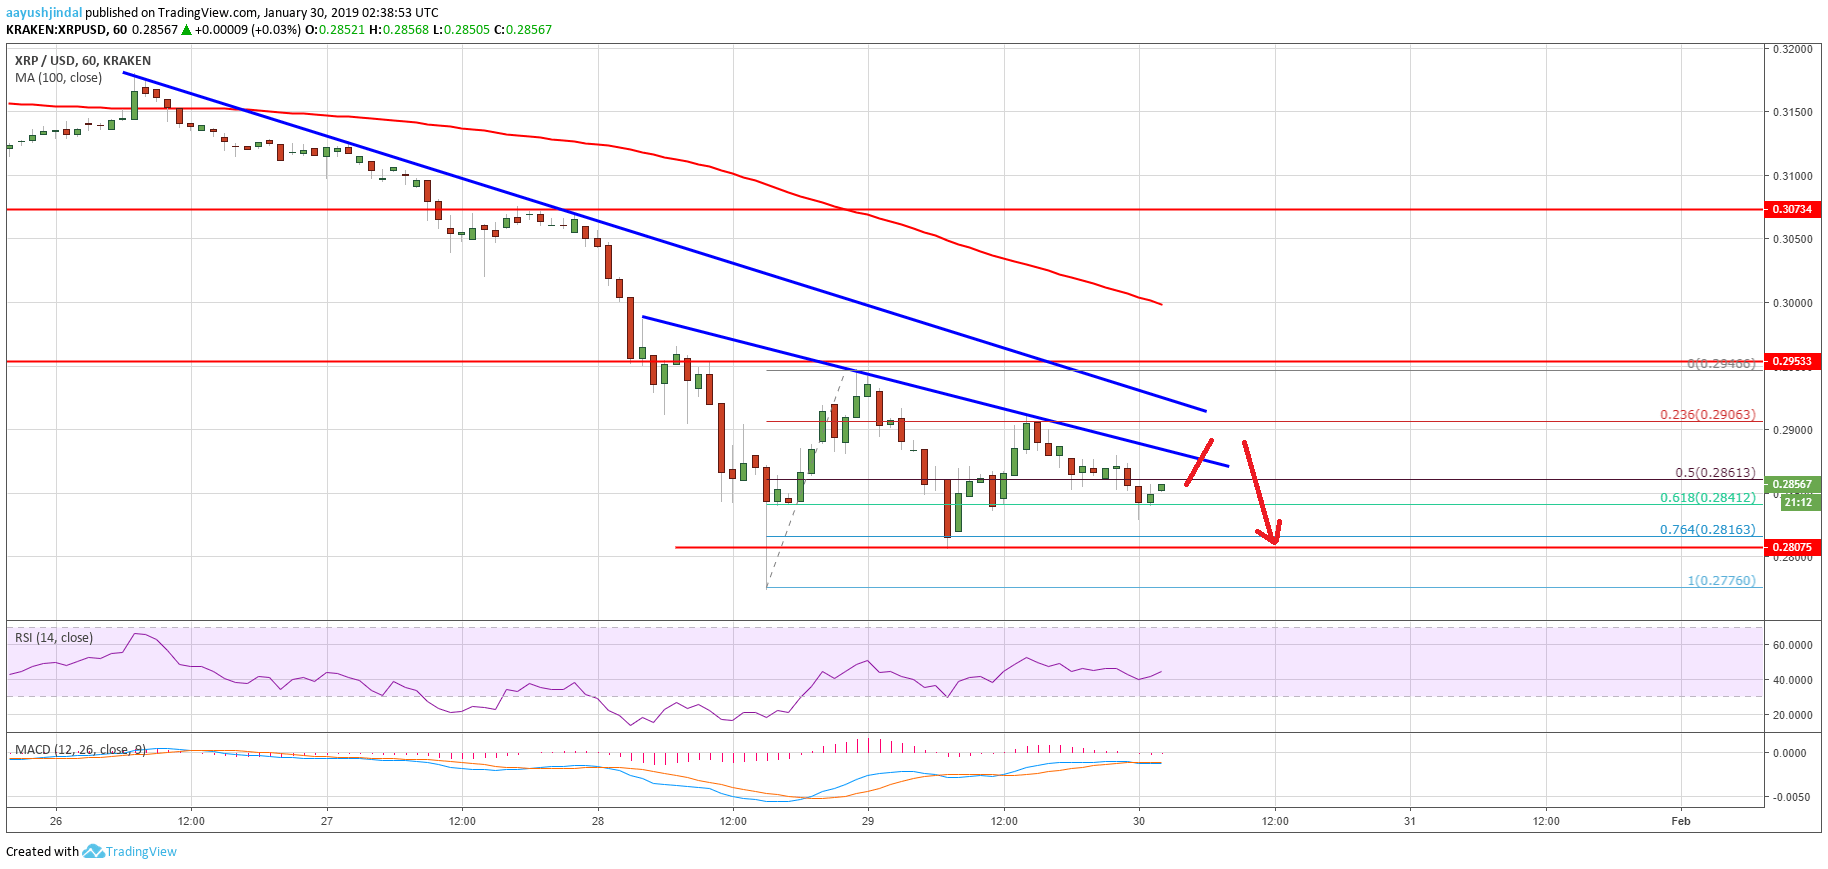
Looking at the chart, ripple price is likely to break the $0.2800 support or even $0.2776 swing low. To start a rebound, the price must surpass the $0.2900 and $0.2950 resistance levels.
Technical Indicators
Hourly MACD – The MACD for XRP/USD is back in the bearish zone, with negative signs.
Hourly RSI (Relative Strength Index) – The RSI for XRP/USD is currently placed above the 40 level, with a positive angle.
Major Support Level – $0.2800
Major Resistance Level – $0.2950