
Reason to trust
How Our News is Made
Strict editorial policy that focuses on accuracy, relevance, and impartiality
Ad discliamer
Morbi pretium leo et nisl aliquam mollis. Quisque arcu lorem, ultricies quis pellentesque nec, ullamcorper eu odio.
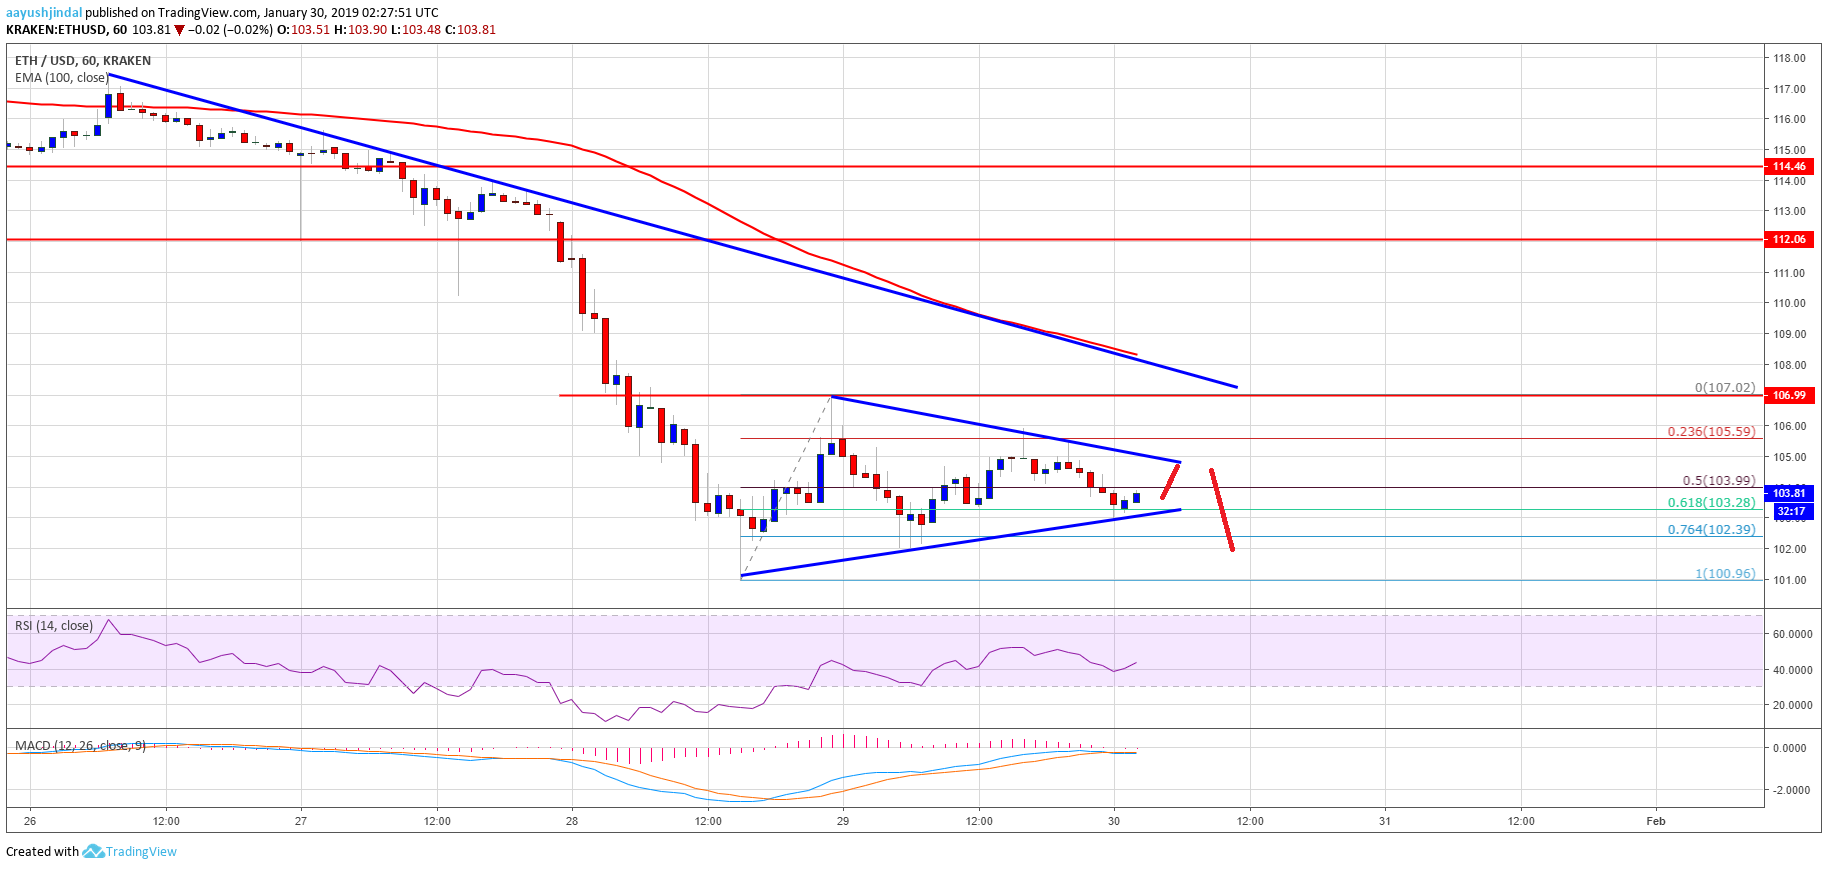
- ETH price stayed below the $107 resistance level, with bearish signs against the US Dollar.
- There is a major bearish pennant formed with resistance near $106 on the hourly chart of ETH/USD (data feed via Kraken).
- The pair could accelerate losses below the $100 level if there is a bearish break below $103.
Ethereum price is forming a bearish continuation pattern against the US Dollar and bitcoin. ETH/USD remains at a risk of more losses as long as it is trading below $107.
Ethereum Price Analysis
Yesterday, we saw a tiny recovery above the $104 level in ETH price against the US Dollar. The ETH/USD pair even traded above the 23.6% Fib retracement level of the last decline from the $114 high to $101 swing low. However, the price failed to break the $107 resistance level. As a result, there was a fresh drop below the $106 level. The price moved below the 50% Fib retracement level of the recent wave from the $101 swing low to $107 high. However, the decline was protected by the $103 level.
More importantly, there is a major bearish pennant formed with resistance near $106 on the hourly chart of ETH/USD. The triangle resistance could play a major role near $106-107. If there is a break above $107, the price may trade towards the $110 and $112 levels. On the other hand, if there is a downside break below $103, the price is likely to accelerate losses in the near term. It seems like the 61.8% Fib retracement level of the recent wave from the $101 swing low to $107 high is currently protecting losses. However, it may soon give up if there is no break above $106 and $107.
Looking at the chart, ETH price is clearly under a lot of pressure below $107. If there is an increase in selling, the price is likely to decline below $103 and $101.
ETH Technical Indicators
Hourly MACD – The MACD for ETH/USD is about to move back in the bearish zone.
Hourly RSI – The RSI for ETH/USD is currently above the 40 level, with a minor bullish angle.
Major Support Level – $101
Major Resistance Level – $107


