
Reason to trust
How Our News is Made
Strict editorial policy that focuses on accuracy, relevance, and impartiality
Ad discliamer
Morbi pretium leo et nisl aliquam mollis. Quisque arcu lorem, ultricies quis pellentesque nec, ullamcorper eu odio.
- Bitcoin price traded to a new monthly low towards $3,340 and later recovered against the US Dollar.
- Yesterday’s highlighted key bearish trend line is intact with resistance at $3,450 on the hourly chart of the BTC/USD pair (data feed from Kraken).
- The price may start a short term rebound if there is a proper break above $3,450 and $3,480.
Bitcoin price dipped to a new yearly low and later recovered against the US Dollar. BTC could decline once again if it fails to break the $3,450-3,480 resistance area in the short term.
Bitcoin Price Analysis
Yesterday, we saw a major decline in bitcoin price below the $3,400 support against the US Dollar. The BTC/USD pair traded below the $3,360 support and formed a new yearly low at $3,344. Later, there was a fresh upside correction above the $3,380 and $3,400 levels. The price moved above the 23.6% Fib retracement level of the last drop from the $3,560 swing high to $3,344 low. Buyers were able to push the price above the $3,420 level, but there is a strong resistance formed near the $3,450 level.
Besides, yesterday’s highlighted key bearish trend line is intact with resistance at $3,450 on the hourly chart of the BTC/USD pair. The trend line resistance coincides with the 50% Fib retracement level of the last drop from the $3,560 swing high to $3,344 low. Therefore, a proper break above the trend line and $3,452 is must for further gains. The next major resistance is near the $3,500 level. An intermediate resistance is $3,480 and the 100 hourly simple moving average. On the other hand, if buyers fail to gain strength above $3,450 and $3,480, there could be a fresh bearish wave.
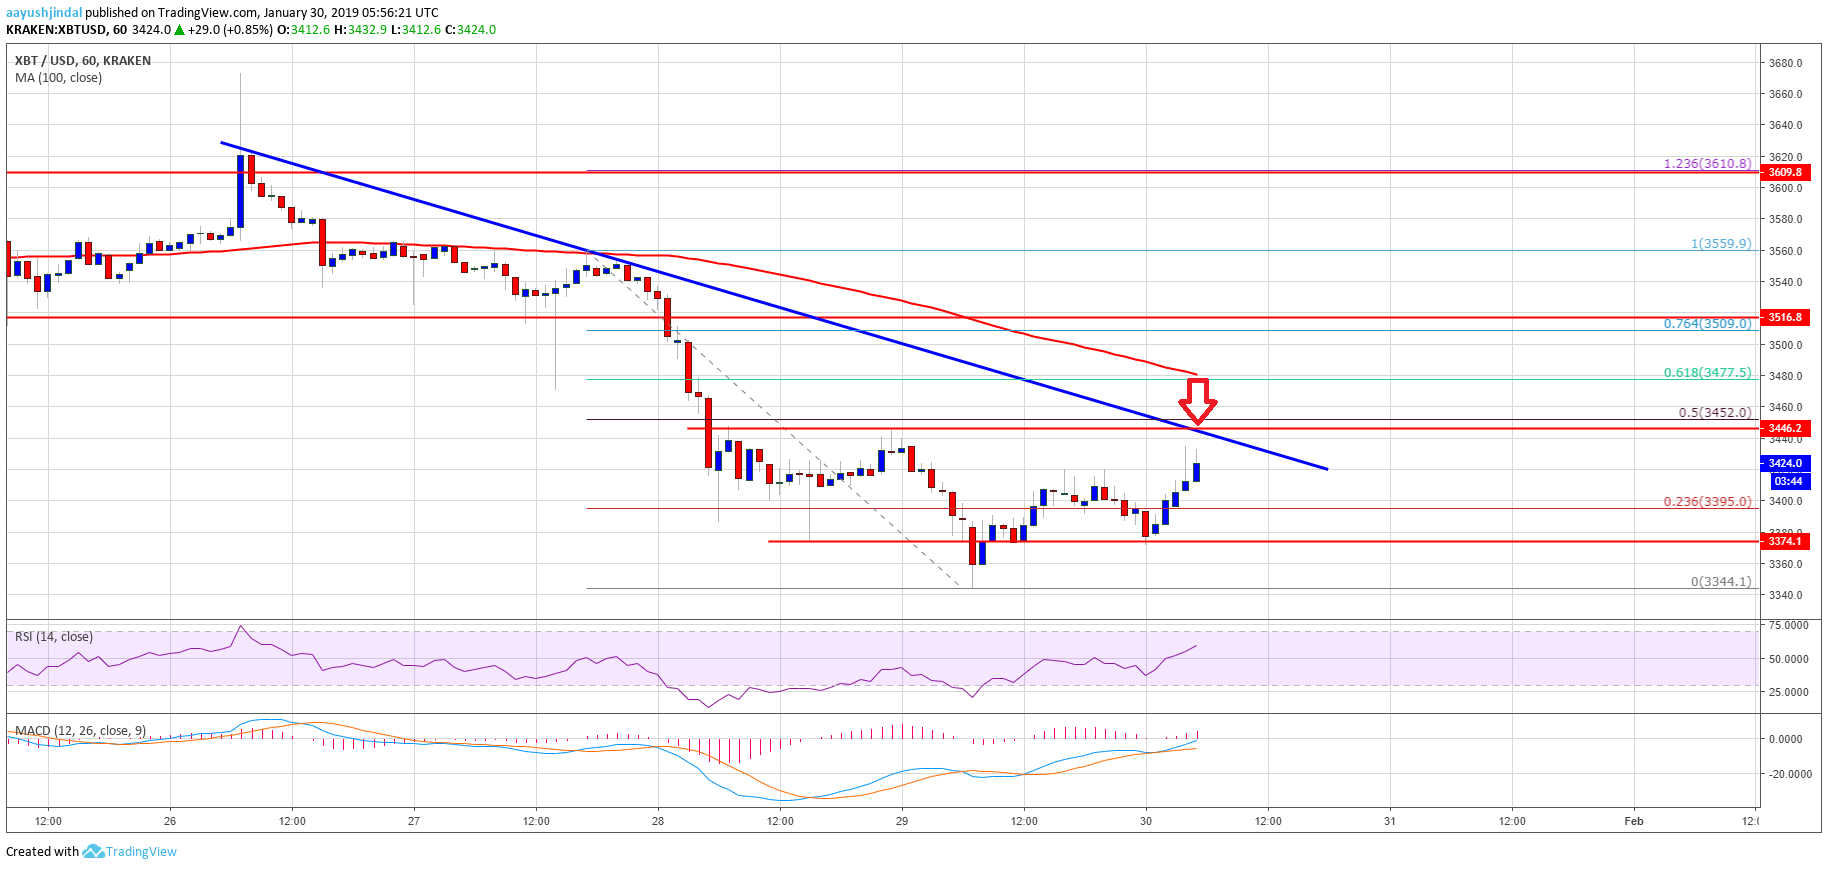
Looking at the chart, bitcoin price is approaching the key $3,450 resistance. On the downside, an initial support is at $3,375, below which the price may revisit the $3,340 level, followed by $3,300.
Technical indicators
Hourly MACD – The MACD for BTC/USD is slowly gaining momentum in the bullish zone.
Hourly RSI (Relative Strength Index) – The RSI for BTC/USD is now placed above the 50 level.
Major Support Level – $3,340
Major Resistance Level – $3,450


