
Reason to trust
How Our News is Made
Strict editorial policy that focuses on accuracy, relevance, and impartiality
Ad discliamer
Morbi pretium leo et nisl aliquam mollis. Quisque arcu lorem, ultricies quis pellentesque nec, ullamcorper eu odio.
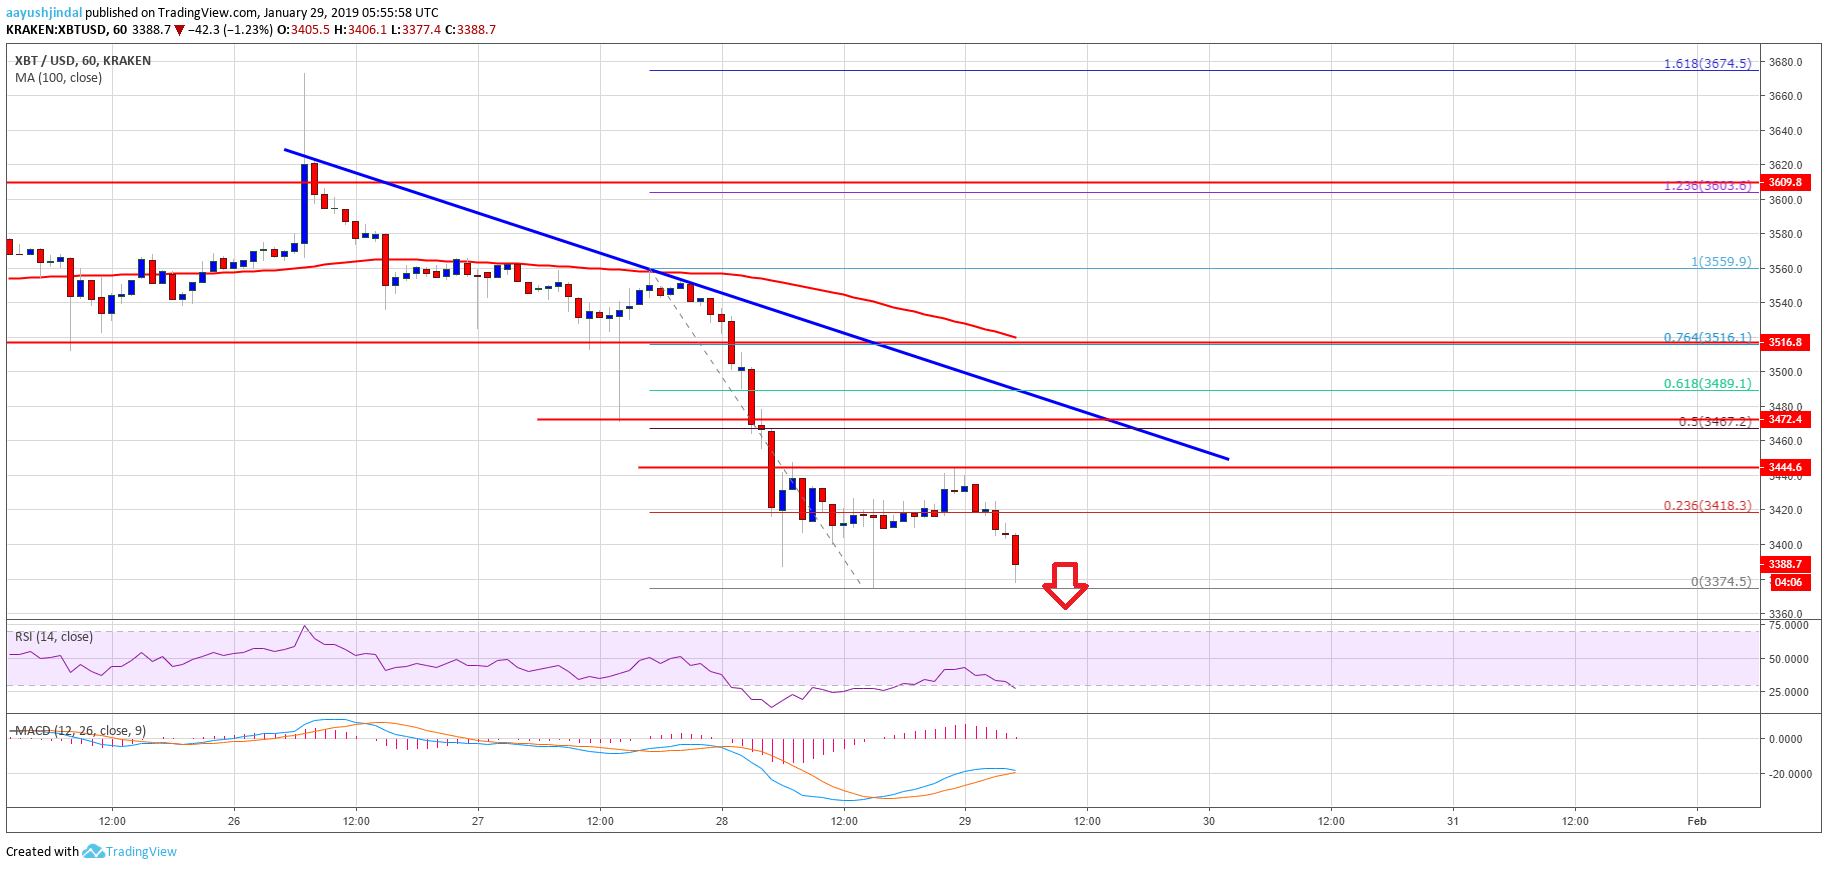
- Bitcoin price extended its decline and traded below the $3,440 support level against the US Dollar.
- There is a major bearish trend line formed with resistance at $3,460 on the hourly chart of the BTC/USD pair (data feed from Kraken).
- The price is currently under a lot of pressure and it may slide further towards $3,200 or $3,000.
Bitcoin price accelerated losses below the $3,500 support against the US Dollar. BTC bears are in full control and it seems like they are eyeing a test of the $3,000 level.
Bitcoin Price Analysis
This week started with a bearish bias below the $3,500 support in bitcoin price against the US Dollar. The BTC/USD pair traded lower and broke the $3,480 and $3,440 support levels. Sellers got control and pushed the price below the $3,400 support. A new yearly low was formed at $3,374 and the price is now trading well below the 100 hourly simple moving average. Recently, there was a short term correction above the $3,400 level. The price corrected above the 23.6% Fib retracement level of the recent decline from the $3,559 high to $3,372 low.
However, the previous supports near $3,440 and $3,450 acted as a strong barrier. The price even struggled to test the 50% Fib retracement level of the recent decline from the $3,559 high to $3,372 low. It is currently trading with a bearish angle below $3,500 and $3,440. An immediate support is at $3,375, below which the price is likely to decline towards the $3,300 and $3,220 supports. The main target for sellers in the medium term could be $3,000. On the upside, there are many hurdles near the $3,500 and $3,440 levels. There is also a major bearish trend line formed with resistance at $3,460 on the hourly chart of the BTC/USD pair.
Looking at the chart, bitcoin price is trading in a downtrend below $3,440. There are high possibilities of more losses towards $3,300, $3,220 and $3,150 in the near term.
Technical indicators
Hourly MACD – The MACD for BTC/USD is about to move back in the bearish zone.
Hourly RSI (Relative Strength Index) – The RSI for BTC/USD is placed well below the 30 level.
Major Support Level – $3,220
Major Resistance Level – $3,460


