
Reason to trust
How Our News is Made
Strict editorial policy that focuses on accuracy, relevance, and impartiality
Ad discliamer
Morbi pretium leo et nisl aliquam mollis. Quisque arcu lorem, ultricies quis pellentesque nec, ullamcorper eu odio.
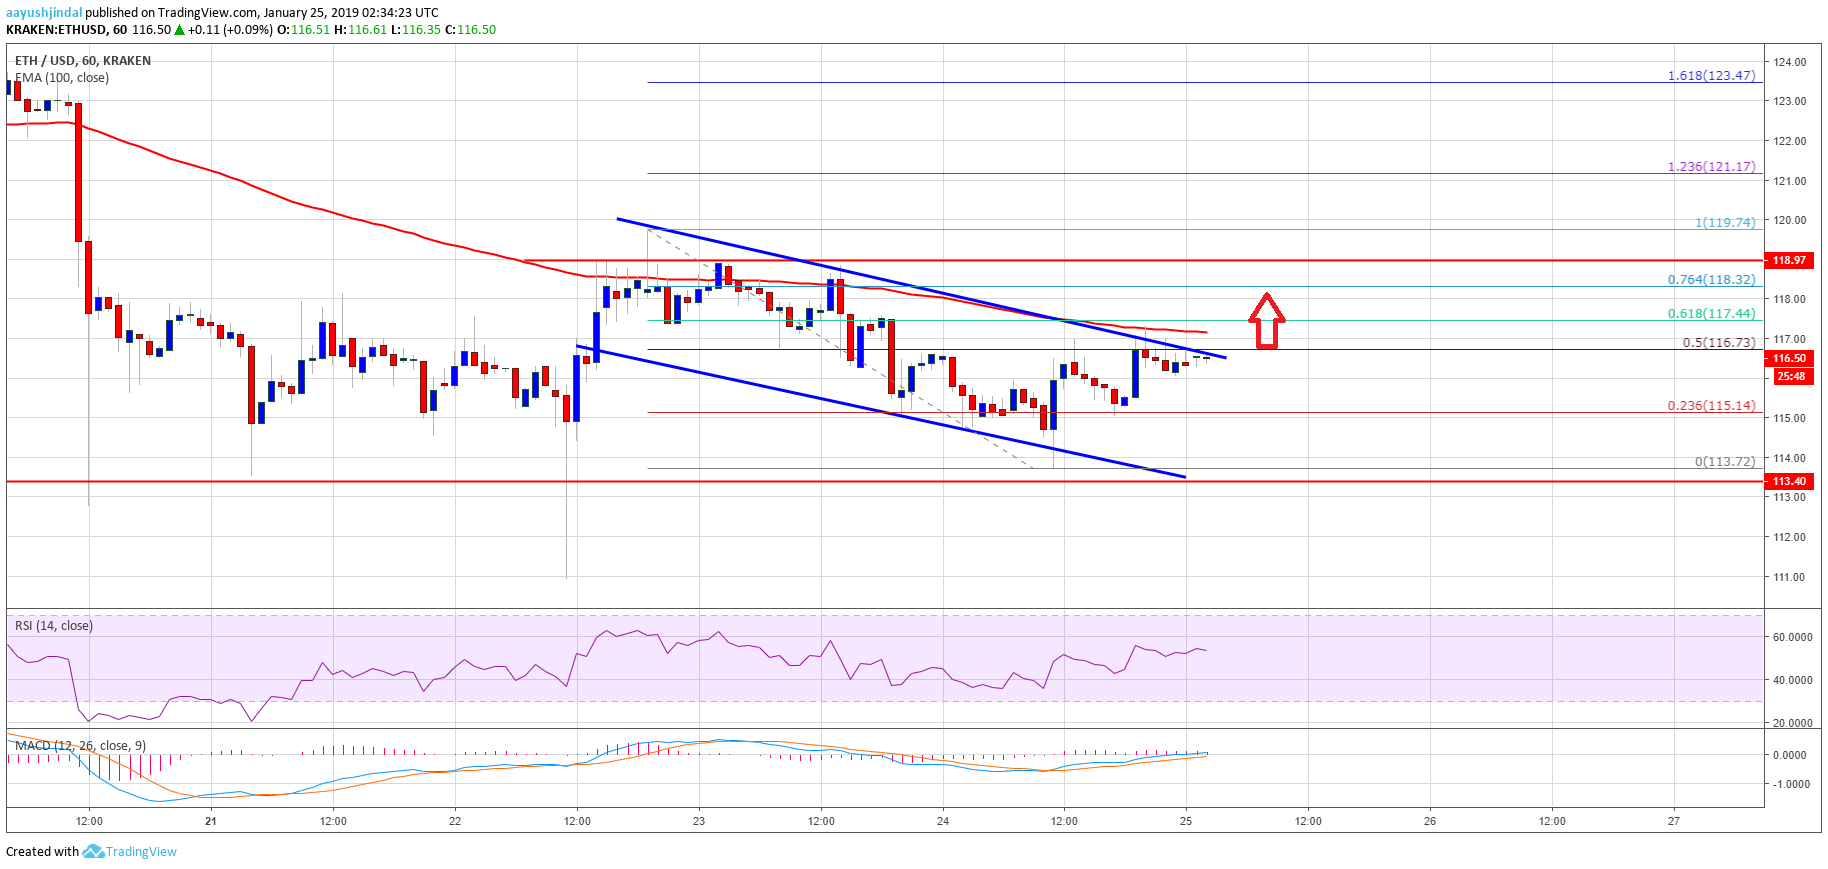
- ETH price revisited the $114 support area and later moved higher against the US Dollar.
- Yesterday’s highlighted declining channel is intact with resistance near $117 on the hourly chart of ETH/USD (data feed via Kraken).
- The pair may soon make the next move either above the $118-119 resistance or below the $114 support.
Ethereum price is confined in a tight range against the US Dollar and bitcoin. ETH/USD is likely setting up for a major move in the coming sessions either above $120 or below $114.
Ethereum Price Analysis
Yesterday, we saw a bearish reaction from the $119-120 resistance zone in ETH price against the US Dollar. The ETH/USD pair declined below the $116 level and revisited the $114 support area. There was even a close below the $116 level and the 100 hourly simple moving average. However, there was a strong buying interest near the $114 support area. Moreover, the 61.8% Fib retracement level of the last upside from the $111 low to $120 high acted as a support. The price bounced back and it slowly moved above the $115 and $116 levels.
Besides, there was a break above the 23.6% Fib retracement level of the recent decline from the $120 swing high to $114 swing low. At the outset, the price is approaching key resistances near $117, $119 and $120. More importantly, yesterday’s highlighted declining channel is intact with resistance near $117 on the hourly chart of ETH/USD. The 100 hourly SMA is also positioned just near the trend line and $117. Finally, the 50% Fib retracement level of the recent decline from the $120 swing high to $114 swing low is near $117.
Looking at the chart, ETH price is recovering, but it remains below the key hurdles such as $117, $119 and $120. A successful break above these is needed for a push towards $130. If not, the price could drop back to $114 or $110.
ETH Technical Indicators
Hourly MACD – The MACD for ETH/USD is slightly placed in the bullish zone.
Hourly RSI – The RSI for ETH/USD is placed just above the 50 level, with a flat structure.
Major Support Level – $114
Major Resistance Level – $119


