Reason to trust
How Our News is Made
Strict editorial policy that focuses on accuracy, relevance, and impartiality
Ad discliamer
Morbi pretium leo et nisl aliquam mollis. Quisque arcu lorem, ultricies quis pellentesque nec, ullamcorper eu odio.
- Bitcoin price failed near key resistances at $3,600 and $3,620 against the US Dollar.
- This week’s followed key bearish trend line is in place with resistance near $3,570 on the hourly chart of the BTC/USD pair (data feed from Kraken).
- The price may continue to move down unless buyers gain strength above the $3,600 and $3,620 levels.
Bitcoin price struggled to surpass the $3,600 pivot zone against the US Dollar. BTC is currently at a risk of more losses towards $3,480 as long as the price is below $3,620.
Bitcoin Price Analysis
Yesterday, we saw a solid upward move above the $3,560 resistance in bitcoin price against the US Dollar. However, the BTC/USD pair ran into a significant resistance area near the $3,600 and $3,620 levels. There was a rejection pattern formed near the $3,615 level. The price also failed to settle above the 61.8% Fib retracement level of the last drop from the $3,708 swing high to $3,465 low. An intraday high was formed at $3,614 and later the price declined below the 100 hourly simple moving average.
The decline was such that the price traded below the $3,560 level. It tested the 50% Fib retracement level of the recent wave from the $3,441 low to $3,614 high. The current price action is clearly bearish below $3,580 and it seems like there could be more declines. The next stop for sellers could be near the $3,500 level and the 61.8% Fib retracement level of the recent wave from the $3,441 low to $3,614 high. Below $3,500, the price is likely to test the $3,480 and $3,460 support levels. On the upside, there are many barriers near the $3,600 level. Moreover, this week’s followed key bearish trend line is in place with resistance near $3,570 on the hourly chart of the BTC/USD pair.
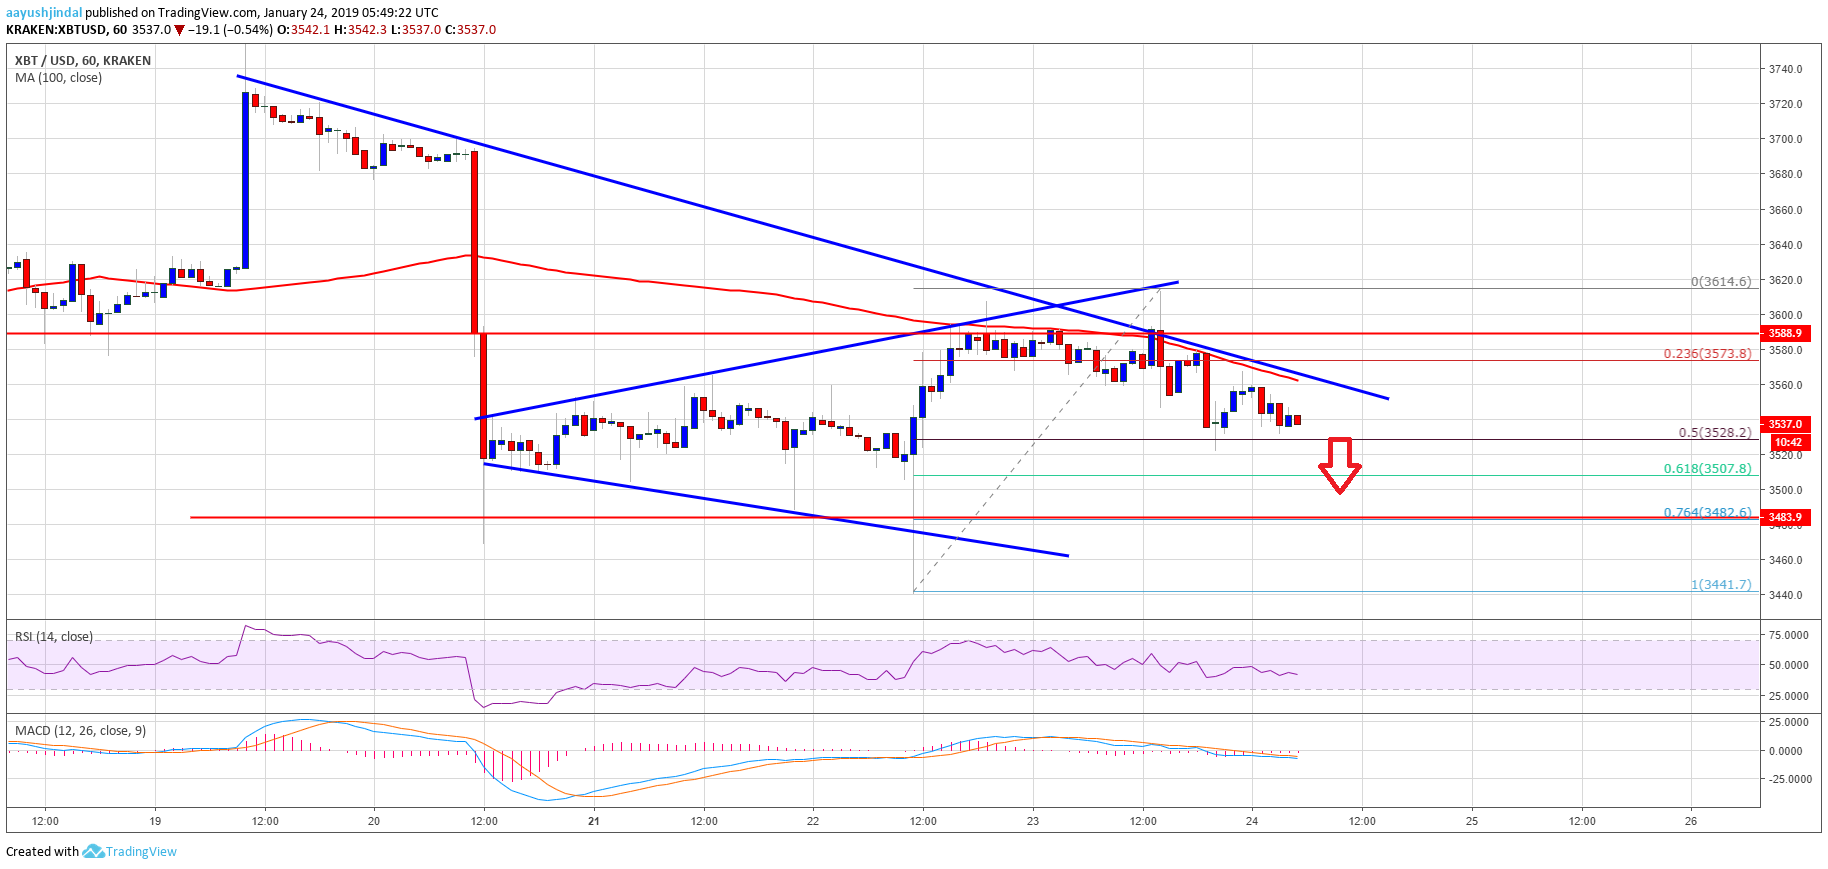
Looking at the chart, bitcoin price is clearly facing a significant barrier near $3,600 and $3,600. Therefore, it could extend the current decline to $3,480 before a fresh upward move.
Technical indicators
Hourly MACD – The MACD for BTC/USD is now placed heavily in the bearish zone.
Hourly RSI (Relative Strength Index) – The RSI for BTC/USD is currently placed well below the 40 level.
Major Support Level – $3,480
Major Resistance Level – $3,600