Reason to trust
How Our News is Made
Strict editorial policy that focuses on accuracy, relevance, and impartiality
Ad discliamer
Morbi pretium leo et nisl aliquam mollis. Quisque arcu lorem, ultricies quis pellentesque nec, ullamcorper eu odio.
- ETH price faced a strong resistance near the $127 and $128 levels recently against the US Dollar.
- There is a major bearish trend line formed with resistance at $125 on the 4-hours chart of ETH/USD (data feed via Kraken).
- The pair must break the $125, $127 and $128 resistance levels to move into a positive zone.
Ethereum price is struggling to clear many hurdles versus the US Dollar and Bitcoin. ETH/USD may climb higher sharply once there is a close above $128 and $130.
Ethereum Price Analysis
This past week, ETH price attempted to recover above the $132 and $133 resistance levels against the US Dollar. The ETH/USD pair tested the $133 level, but it failed to gain traction. As a result, there was a fresh decline and the price moved below the $130 and $125 support levels. There was a break below the 122 level and the price settled below the 100 simple moving average (4-hours). Moreover, there was a break below the 61.8% Fib retracement level of the last wave from the $113 swing low to $133 high.
The price tested the $117-118 support and found a decent buying interest. Besides, the 76.4% Fib retracement level of the last wave from the $113 swing low to $133 high acted as a support. Later, the price recovered, but it seems to be struggling to clear the $127 and $128 resistance levels. More importantly, there is a major bearish trend line formed with resistance at $125 on the 4-hours chart of ETH/USD. Therefore, the price must break the $125, $127 and $128 resistance levels to start a fresh upward move. The next key resistance is at $133, above which the price may climb towards the $140 level.
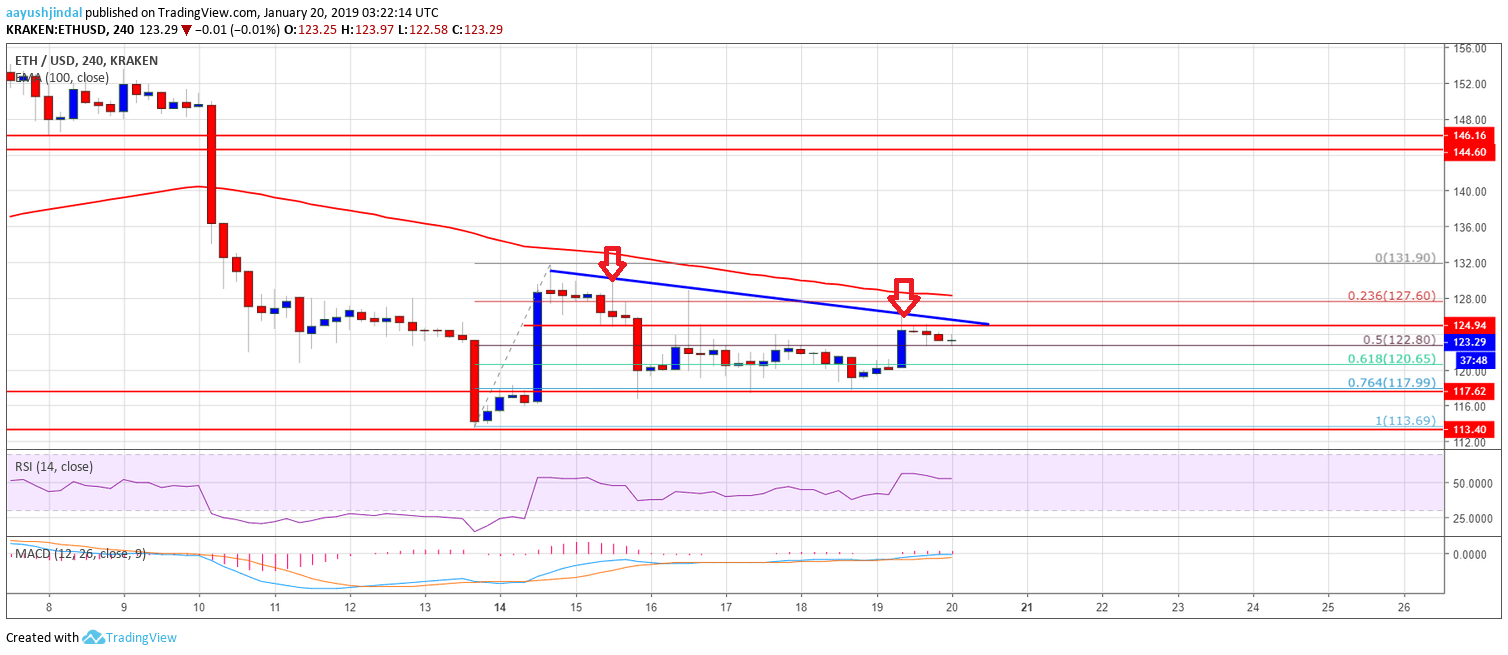
The above chart indicates that ETH price remains well supported near the $120 and $117 support levels. Having said that, a break above $128 is needed for a decent bullish wave.
Technical Indicators
4-hours MACD – The MACD for ETH/USD is slowly moving into the bullish zone, with a few bullish signs.
4-hours RSI – The RSI for ETH/USD is now placed nicely above the 30 level.
Major Support Level – $117
Major Resistance Level – $128