
Reason to trust
How Our News is Made
Strict editorial policy that focuses on accuracy, relevance, and impartiality
Ad discliamer
Morbi pretium leo et nisl aliquam mollis. Quisque arcu lorem, ultricies quis pellentesque nec, ullamcorper eu odio.
- ETH price is currently consolidating above the $116 and $117 support levels against the US Dollar.
- Yesterday’s highlighted key bearish trend line is active with resistance at $126 on the hourly chart of ETH/USD (data feed via Kraken).
- The pair may gain bullish momentum sooner or later as long as it is above the $116 support.
Ethereum price is trading in ranges against the US Dollar and bitcoin. ETH/USD might start a solid upward move if it continues to hold the $116 support area in the near term.
Ethereum Price Analysis
Recently, ETH price climbed above the $125 resistance made an attempt to break $128 against the US Dollar. However, the ETH/USD pair failed to gain strength above the $128 resistance and later declined. It moved below the $125 and $123 support levels. More importantly, there was a break below the $121 level and the 100 hourly simple moving average. However, the $116 and $117 support levels once again acted as a solid support and prevented more declines.
A low was formed near $117.27 and the price later recovered. It climbed above the 23.6% Fib retracement level of the last drop from the $128 high to $117 low. On the upside, there are many hurdles for buyers, starting with the $123 level and the 100 hourly simple moving average. It also coincides with the 50% Fib retracement level of the last drop from the $128 high to $117 low. Besides, yesterday’s highlighted key bearish trend line is active with resistance at $126 on the hourly chart of ETH/USD. An intermediate resistance is near the $125 level and the 61.8% Fib retracement level of the last drop.
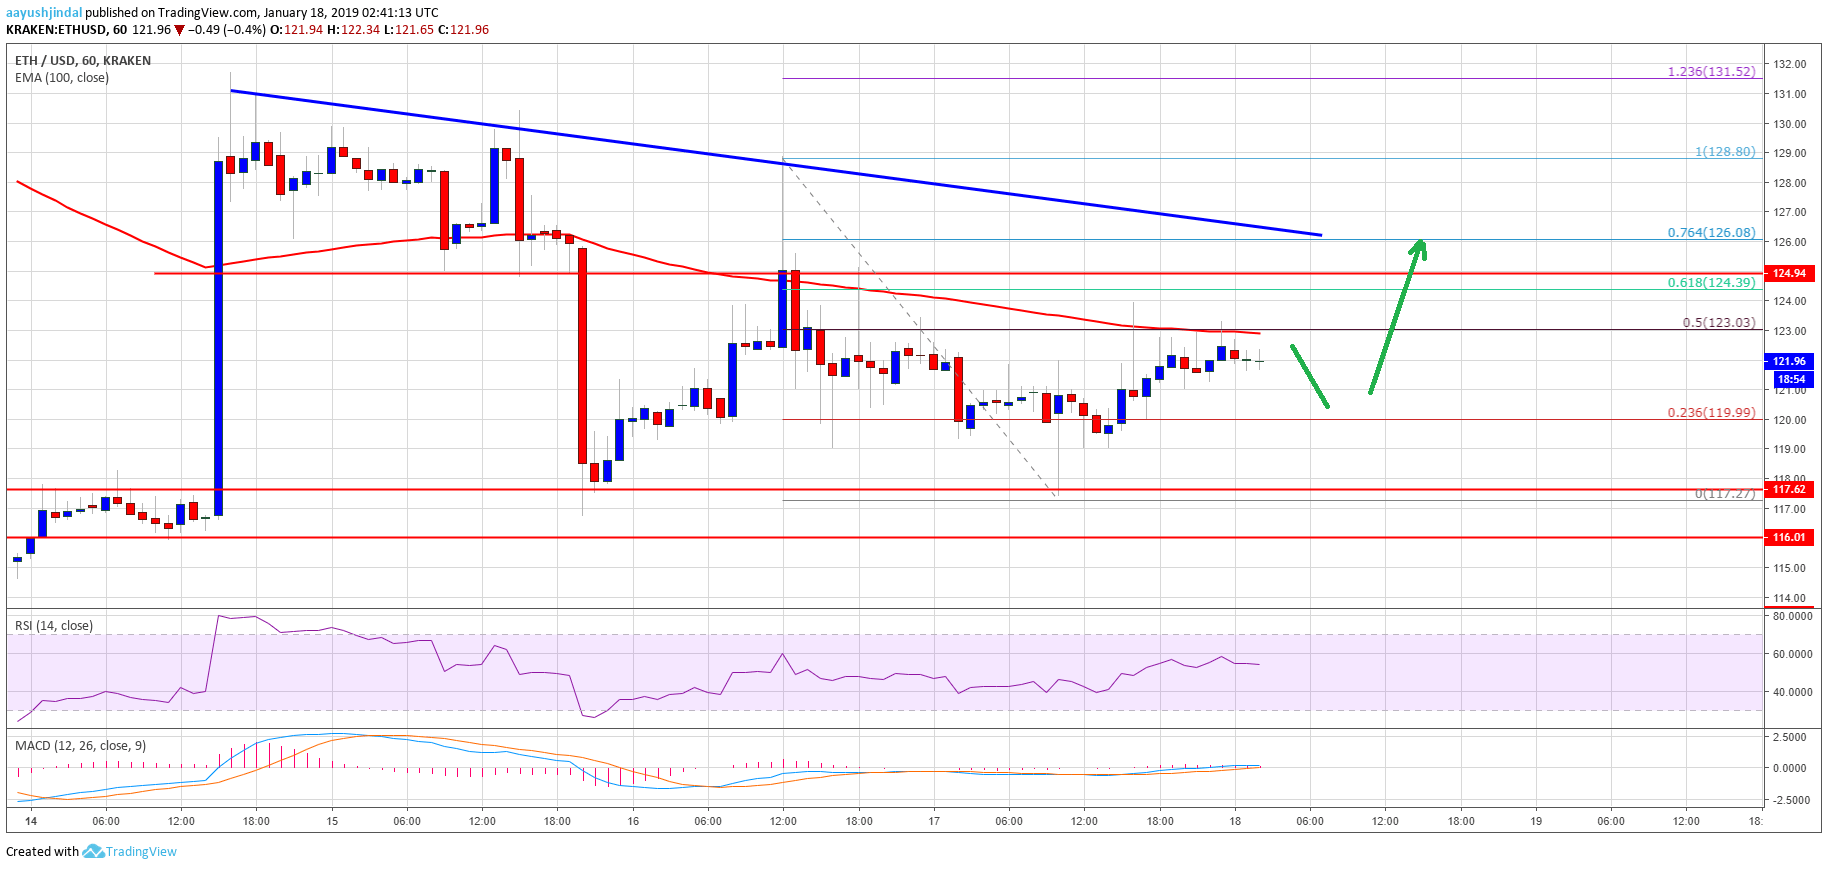
Looking at the chart, ETH price is likely to struggle to clear the $123, $125 and $128 resistance levels. Having said that, as long as the price is above $116, it could start a steady rise in the near term.
ETH Technical Indicators
Hourly MACD – The MACD for ETH/USD is slightly placed in the bullish zone, with a flat structure.
Hourly RSI – The RSI for ETH/USD is moving nicely above the 50 level, but with no bullish signals.
Major Support Level – $116
Major Resistance Level – $128