
Reason to trust
How Our News is Made
Strict editorial policy that focuses on accuracy, relevance, and impartiality
Ad discliamer
Morbi pretium leo et nisl aliquam mollis. Quisque arcu lorem, ultricies quis pellentesque nec, ullamcorper eu odio.
- ETH price rallied recently and recovered sharply above $121 and $126 against the US Dollar.
- Yesterday’s highlighted important bearish trend line was breached at $121 on the hourly chart of ETH/USD (data feed via Kraken).
- The pair tested the $130-132 resistance area and now it may correct a few points in the near term.
Ethereum price jumped back above key pivot levels against the US Dollar and bitcoin. ETH/USD could continue to move higher towards $136 after a minor downside correction.
Ethereum Price Analysis
Yesterday, we saw a nasty decline below the $121 and $115 supports in ETH price against the US Dollar. The ETH/USD pair traded as low as $113.48 and started consolidating. Later, sellers slowly lost control, resulting in a bullish reaction above $115 and $118. The price rallied more than $15 and broke the $121 and $126 resistance levels. There was also a break above the 23.6% Fib retracement level of the last major decline from the $151 high to $113 low.
More importantly, yesterday’s highlighted important bearish trend line was breached at $121 on the hourly chart of ETH/USD. The pair settled above the $125 level and the 100 hourly simple moving average. It traded close to the 50% Fib retracement level of the last major decline from the $151 high to $113 low. At the moment, the price is consolidating gains above the $125 level and the 100 hourly SMA. Dips from the current levels remain supported near $125 and $124. The main support is now $121-122, below which the price might move back in a bearish zone.
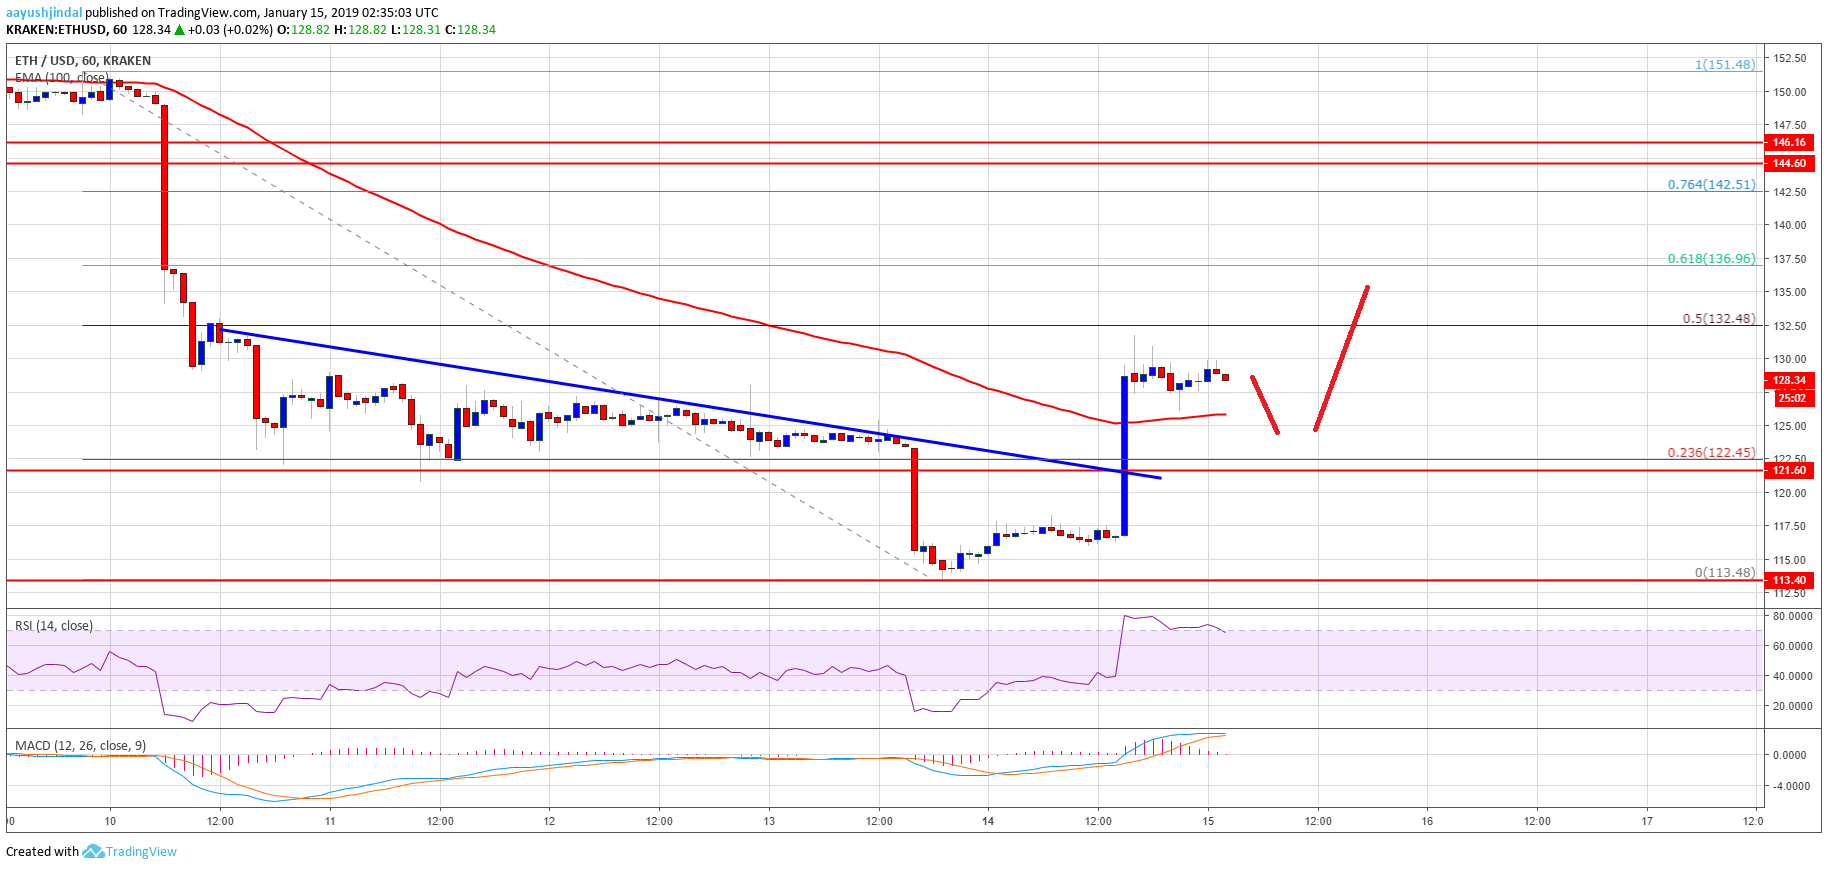
Looking at the chart, ETH price is showing a few positive signs above $121 and $125. If it breaks the $130-132 zone, there could be more gains in the near term. The next stop could be $136, which is the 61.8% Fib retracement level of the last major decline.
ETH/USD Technical Indicators
Hourly MACD – The MACD for ETH/USD is slowly reducing its bullish slope, signaling a short term correction.
Hourly RSI – The RSI for ETH/USD is currently well above the 60 level, with a minor bearish angle.
Major Support Level – $121
Major Resistance Level – $132