
Reason to trust
How Our News is Made
Strict editorial policy that focuses on accuracy, relevance, and impartiality
Ad discliamer
Morbi pretium leo et nisl aliquam mollis. Quisque arcu lorem, ultricies quis pellentesque nec, ullamcorper eu odio.
Key Highlights
- ETH price declined further and broke the $121 support area against the US Dollar.
- There are two bearish trend lines formed with resistance near $121 on the hourly chart of ETH/USD (data feed via Kraken).
- The pair may correct higher in the short term, but it remains a sell near the $120 and $121 levels.
Ethereum price extended losses and declined below key supports against the US Dollar and bitcoin. ETH/USD may continue to move down and it could even test the $100 handle.
Ethereum Price Analysis
In the weekly analysis, we discussed the key $120 and $121 supports for ETH price against the US Dollar. The ETH/USD pair struggled to stay above the $121 support and later fell sharply. It broke the $121 and $120 support levels to test the next support at $114. A low was formed around the $113.45 level and the price is currently correcting higher. An initial hurdle is the 23.6% Fib retracement level of the recent decline from the $128 high to $113 low.
If there is a break above the $117 and $118 levels, the price may trade towards the $120-121 zone. The stated $120-121 zone was a support earlier and now it may prevent gains. More importantly, there are two bearish trend lines formed with resistance near $121 on the hourly chart of ETH/USD. Additionally, the 50% Fib retracement level of the recent decline from the $128 high to $113 low is at $121. Therefore, if the price corrects higher towards the $120 and $121 levels, it could find a strong selling interest. Above $121 and trend lines, the price could recover towards the 100 hourly simple moving average.
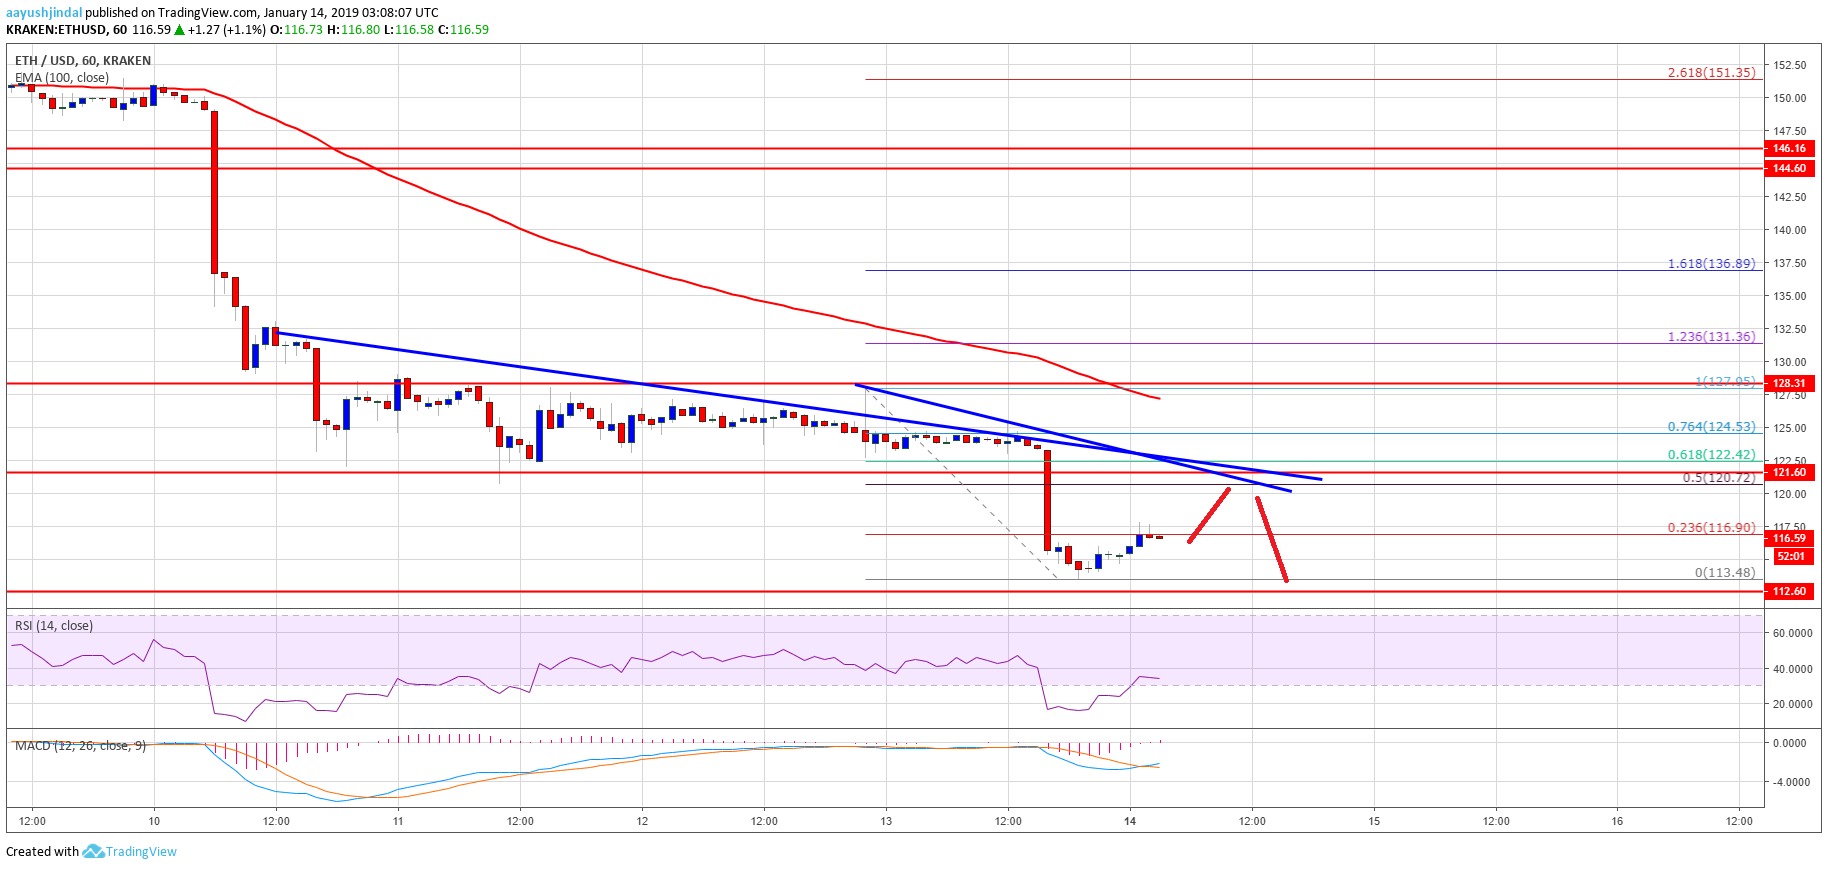
Looking at the chart, ETH price is under a lot of pressure below $121 and $128. If sellers remain in action, the price will most likely slide towards the $105 or $100 levels.
Hourly MACD – The MACD for ETH/USD is about to move into the bullish zone, with lack of momentum.
Hourly RSI – The RSI for ETH/USD is currently recovering above the 30 level, but the overall bias is still bearish.
Major Support Level – $113
Major Resistance Level – $121