
Reason to trust
How Our News is Made
Strict editorial policy that focuses on accuracy, relevance, and impartiality
Ad discliamer
Morbi pretium leo et nisl aliquam mollis. Quisque arcu lorem, ultricies quis pellentesque nec, ullamcorper eu odio.
Key Highlights
· ETH price failed to stay above the $155 support and declined recently against the US Dollar.
· Yesterday’s highlighted key bullish trend line was breached with support at $150 on the hourly chart of ETH/USD (data feed via Kraken).
· The pair may continue to correct lower towards the $144 or $139 support level.
Ethereum price is slowly moving in the bearish zone against the US Dollar and bitcoin. ETH/USD may accelerate the current correction towards $144 or $139.
Ethereum Price Analysis
Recently, ETH price failed to clear the $159-160 resistancezone against the US Dollar. The ETH/USD pair started a downside correction and traded below the $155 and $150 support levels. There was even a close below the $155 support and the 100 hourly simple moving average. The price also declined below the 76.4% Fib retracement level of the recent leg from the $147 low to $160 high.
More importantly, yesterday’s highlighted key bullish trend line was breached with support at $150 on the hourly chart of ETH/USD. The pair tested the $147 swing low and it is currently trading below the 100 hourly SMA. On the downside, the next support is near the $144 level. It is the 1.236 Fib extension level of the recent leg from the $147 low to $160 high. If there are more losses, the price may trade towards the $139-140 support zone. Besides, the 1.618 Fib extension level of the recent leg is also near the $139 level. On the upside, the broken support near the $150-152 zone and the 100 hourly SMA could act as a resistance.
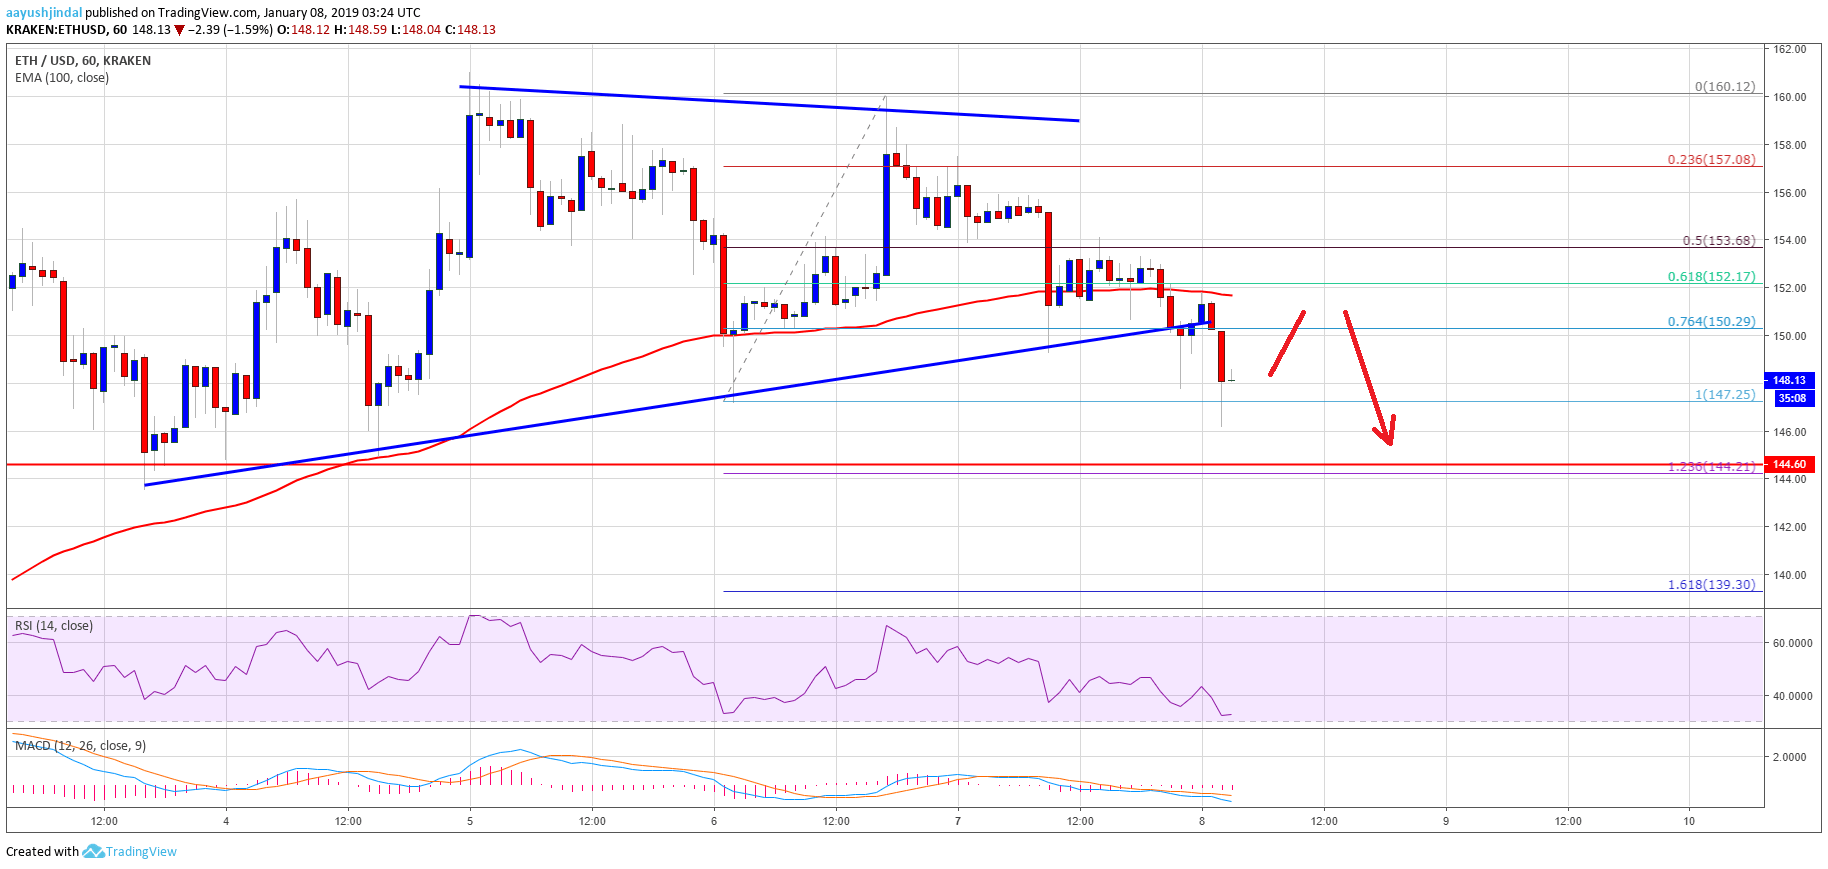
Looking at the chart, ETH price may correct a few points higher, but it likely to face sellers near $152. If there is a bearish continuation, the price may perhaps continue to move down towards the $144 or $139 supports. Overall, selling near the $152 level may be considered in the short term for a test of $144 or $139.
Hourly MACD – The MACD for ETH/USD is now placed in the bearish zone, suggesting more declines.
Hourly RSI – The RSI for ETH/USD is now well below the 50 level, with a bearish angle.
Major Support Level – $144
Major Resistance Level – $152