
Reason to trust
How Our News is Made
Strict editorial policy that focuses on accuracy, relevance, and impartiality
Ad discliamer
Morbi pretium leo et nisl aliquam mollis. Quisque arcu lorem, ultricies quis pellentesque nec, ullamcorper eu odio.
- Bitcoin price finally broke the $4,000 barrier and traded towards $4,100 against the US Dollar.
- There was a break above a major bearish trend line with resistance at $3,830 on the hourly chart of the BTC/USD pair (data feed from Kraken).
- The price is currently consolidating gains and dips towards $4,000 and $3,920 remain supported.
Bitcoin price gained bullish momentum and cleared $4,000 against the US Dollar. BTC could correct a few points, but it is likely to resume uptrend above $4,100.
Bitcoin Price Analysis
Recently, we discussed about a possible upside break above $4,000 in bitcoin price against the US Dollar. The BTC/USD pair did move higher and broke the $3,950 and $4,000 resistance levels. The recent upward move was strong as the price even cleared the $4,050 level and 100 hourly simple moving average. More importantly, there was a solid hourly candle formed, piercing the $4,000 barrier.
During the rise, there was a break above a major bearish trend line with resistance at $3,830 on the hourly chart of the BTC/USD pair. The pair traded as high as $4,082 and later started consolidating gains. An initial support is the 23.6% Fib retracement level of the last wave from the $3,762 low to $4,082 high. Below $4,000, the price may move towards the $3,920 support level. It represents the 50% Fib retracement level of the last wave from the $3,762 low to $4,082 high. The main support for buyers is near the $3,860 level, which was a strong resistance this past week. Therefore, if there is a downside correction, the price may find bids near the $4,000 and $3,920 levels.
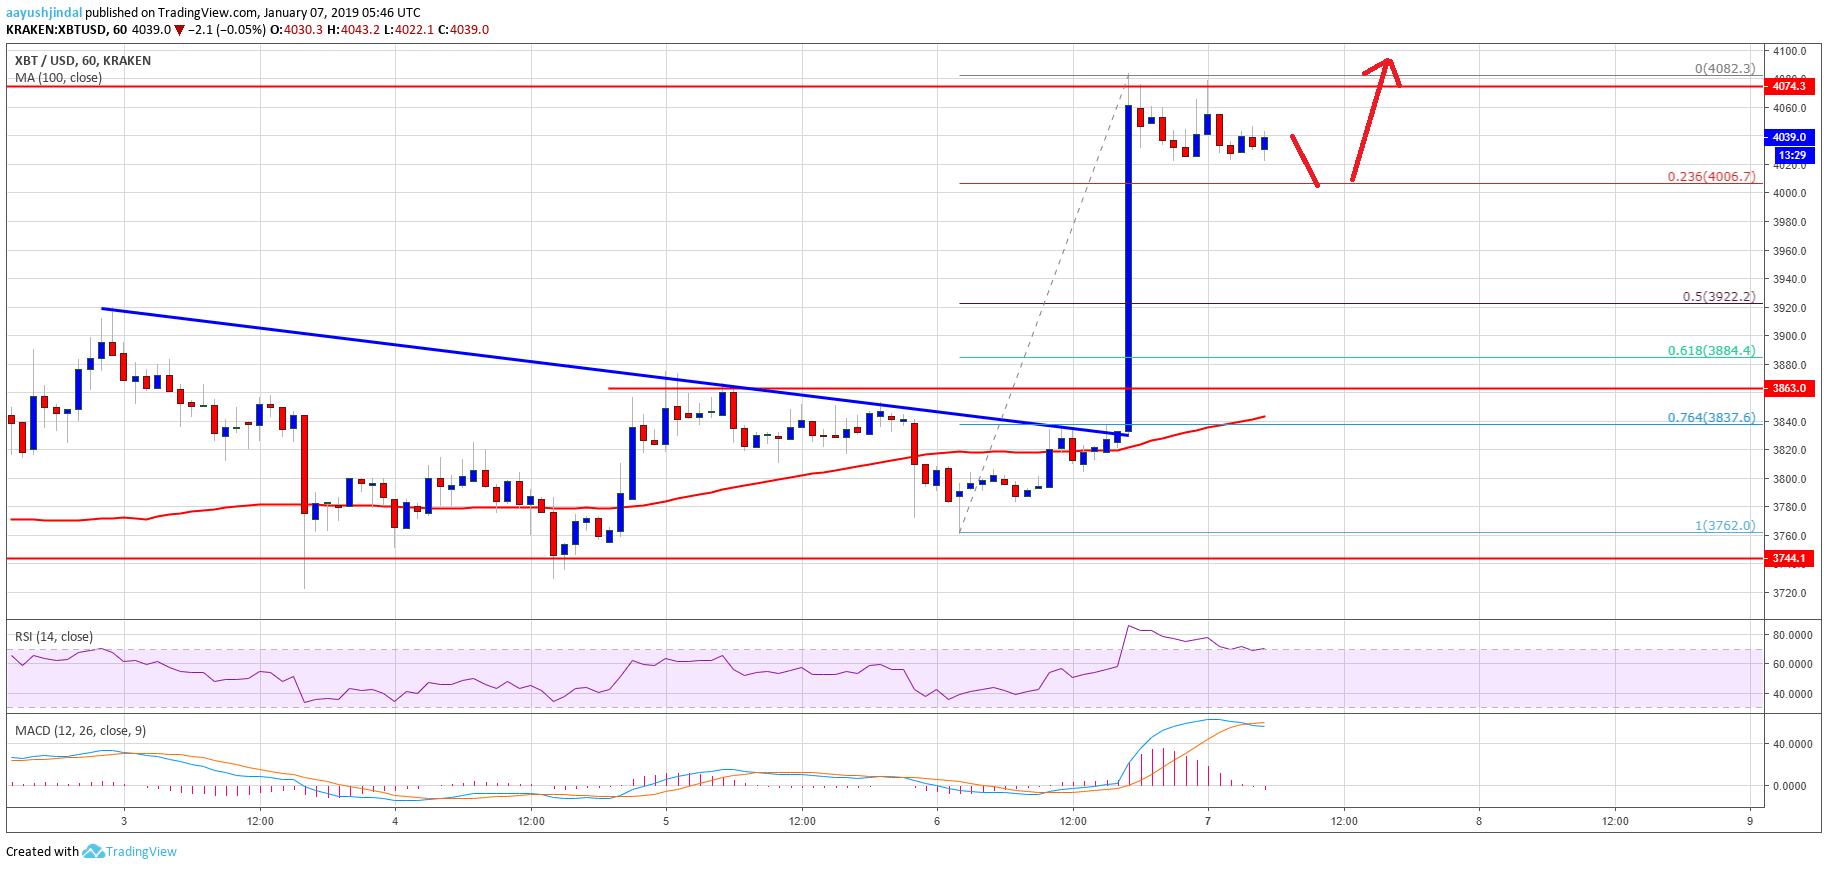
Looking at the chart, bitcoin price clearly broke a crucial resistance near $4,000 and $4,050. It is currently placed nicely above the 100 hourly SMA, but it must clear the $4,080-4,100 barrier for more gains. The next key resistance is at $4,200 followed by $4,220.
Technical indicators
Hourly MACD – The MACD for BTC/USD is slowly moving in the bearish zone, suggesting a downside correction.
Hourly RSI (Relative Strength Index) – The RSI for BTC/USD is well below the 60 level, with a positive bias.
Major Support Level – $3,920
Major Resistance Level – $4,100