
Reason to trust
How Our News is Made
Strict editorial policy that focuses on accuracy, relevance, and impartiality
Ad discliamer
Morbi pretium leo et nisl aliquam mollis. Quisque arcu lorem, ultricies quis pellentesque nec, ullamcorper eu odio.
Key Points
- Bitcoin price failed to gain momentum above $3,900 and declined recently against the US Dollar.
- There is a major contracting triangle formed with support at $3,765 on the 4-hours chart of the BTC/USD pair (data feed from Kraken).
- The pair is approaching the next significant break either above $3,850 or below $3,750.
Bitcoin price is trading near important support levels against the US Dollar. BTC/USD may soon make the next move either above $4,000 or below $3,500.
Bitcoin Price Analysis
This past week, bitcoin price moved higher above the $3,800 resistance against the US Dollar. However, the BTC/USD pair struggled a lot to clear the $3,900 resistance level. To start with, a swing low was formed near $3,720 and later the price started an upward move. It broke the $3,800 resistance and the 100 simple moving average (4-hours). The price even traded above the 50% Fib retracement level of the last decline from the $3,920 high to $3,722 low.
However, the price faced a strong resistance near the $3,850 and $3,870 levels. Besides, the 76.4% Fib retracement level of the last decline from the $3,920 high to $3,722 low also prevented gains. Buyers failed to push the price above $3,900 and later the price declined. It traded below $3,800 and the 100 SMA. Having said that, the price is now approaching the key support area near $3,765. More importantly, there is a major contracting triangle formed with support at $3,765 on the 4-hours chart of the BTC/USD pair.
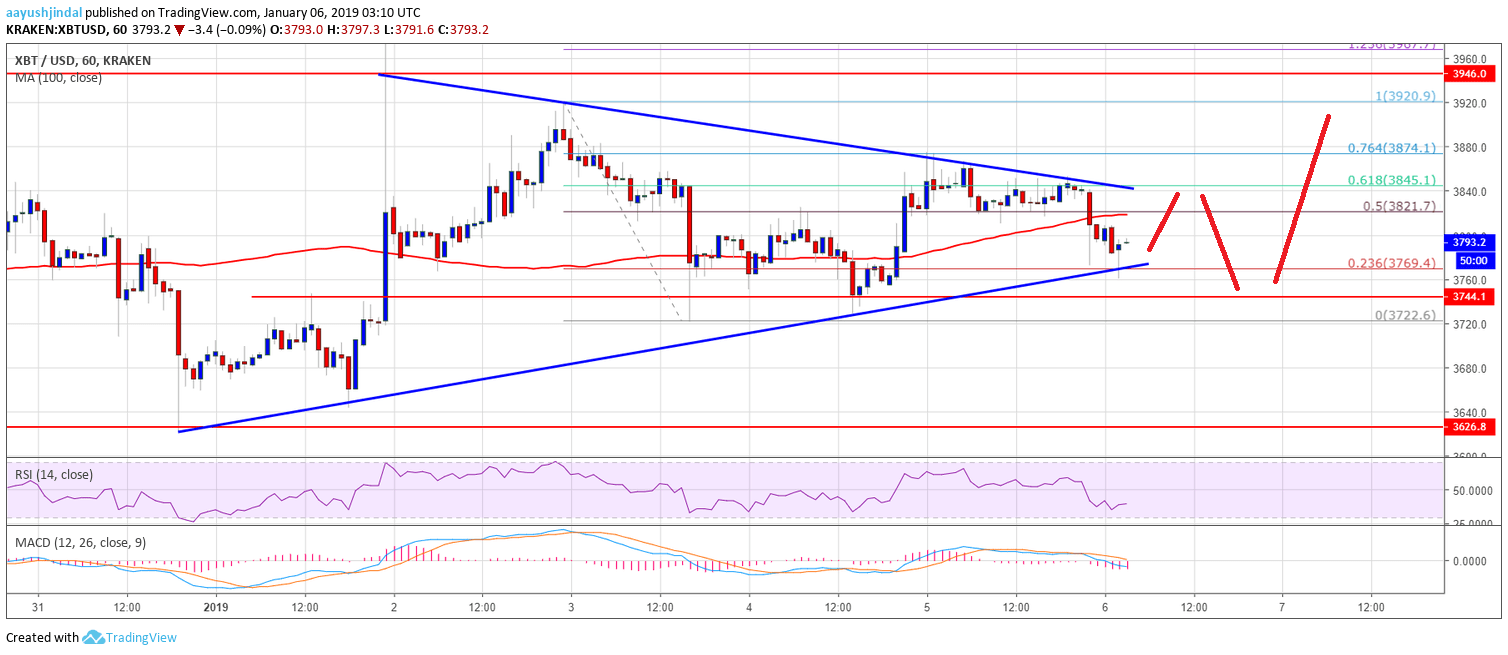
Looking at the chart, BTC price seems to approaching the next significant break either above $3,850 or below $3,765. An upside break above $3,850 may push the price towards $4,000 and $4,200. On the other hand, a break below $3,765 could spark bearish moves towards $3,500 or $3,300.
Looking at the technical indicators:
4-hours MACD – The MACD for BTC/USD is placed in the bearish zone.
4-hours RSI (Relative Strength Index) – The RSI is currently well below the 50 level.
Major Support Level – $3,765
Major Resistance Level – $3,850


