Reason to trust
How Our News is Made
Strict editorial policy that focuses on accuracy, relevance, and impartiality
Ad discliamer
Morbi pretium leo et nisl aliquam mollis. Quisque arcu lorem, ultricies quis pellentesque nec, ullamcorper eu odio.
Key Points
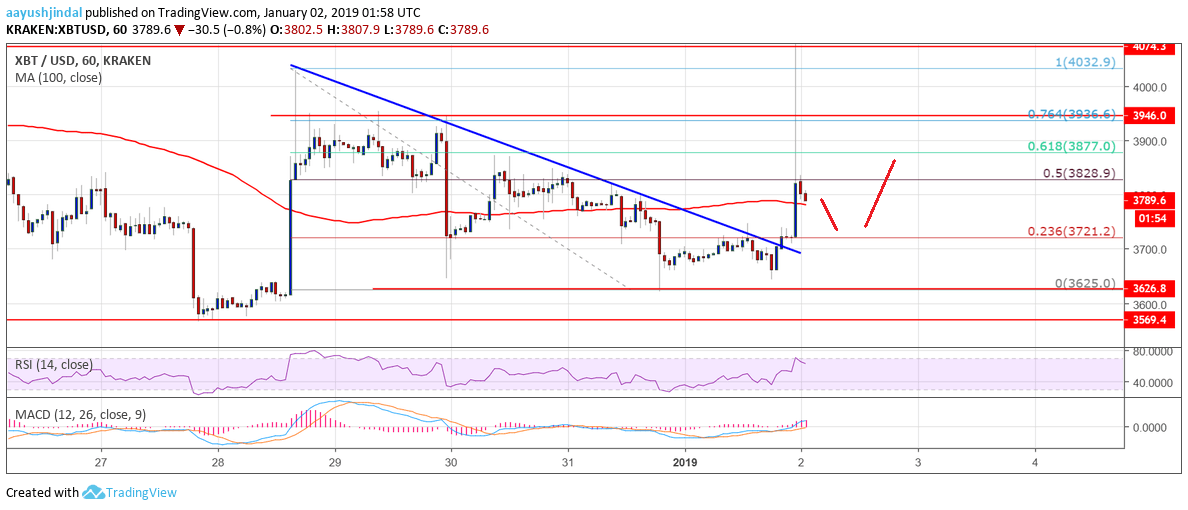
- Bitcoin price formed a support base near $3,625 and later moved higher against the US Dollar.
- There was a break above a major bearish trend line with resistance at $3,710 on the hourly chart of the BTC/USD pair (data feed from Kraken).
- The price is placed nicely above the $3,700 level and it may continue to move higher in the near term.
Bitcoin price is gaining bullish momentum against the US Dollar. BTC may dip a few points, but it remains supported near $3,700 and $3,625.
Bitcoin Price Analysis
Recently, there was a downside reaction from the $4,032 high in bitcoin price against the US Dollar. The BTC/USD pair traded below the $3,900 and $3,820 support levels. Later, the price declined below the $3,700 level before buyers appeared near the $3,625 support. A base was formed and the price started a fresh upward move. It broke the $3,700 resistance and the 100 hourly simple moving average.
The price cleared the 23.6% Fib retracement level of the last decline from the $4,032 high to $3,625 low. Moreover, there was a break above a major bearish trend line with resistance at $3,710 on the hourly chart of the BTC/USD pair. The price spiked above the 50% Fib retracement level of the last decline from the $4,032 high to $3,625 low. However, there was no proper close above the $3,820-3,850 resistance area. At the outset, the price is correcting lower and it may dip a few points towards the $3,720 or $3,700 levels.
Looking at the chart, bitcoin price remains well supported on the downside above $3,700 and $3,625. On the upside, buyers need to clear the $3,850 and $3,890 resistance levels to push the price towards $4,000.
Looking at the technical indicators:
Hourly MACD – The MACD for BTC/USD is showing positive signs in the bullish zone.
Hourly RSI (Relative Strength Index) – The RSI is placed well above the 50 level with a minor bearish angle.
Major Support Level – $3,700
Major Resistance Level – $3,850